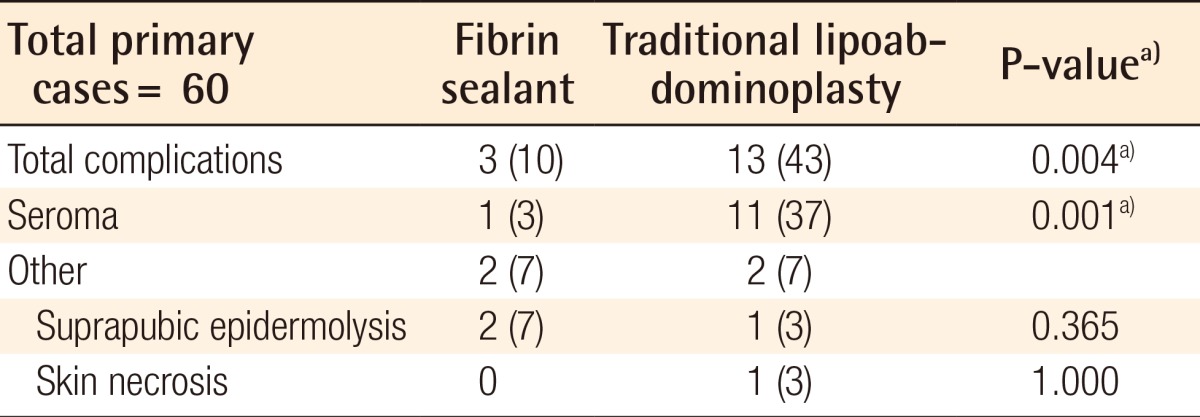
Table 2.
Complications and revision rates in each of the 2 groups

Values are presented as number (%).
a)Significant differences. Group A had a significantly lower total complication rate and seroma formation rate compared to group B.
Complications and revision rates in each of the 2 groups

Values are presented as number (%).
a)Significant differences. Group A had a significantly lower total complication rate and seroma formation rate compared to group B.