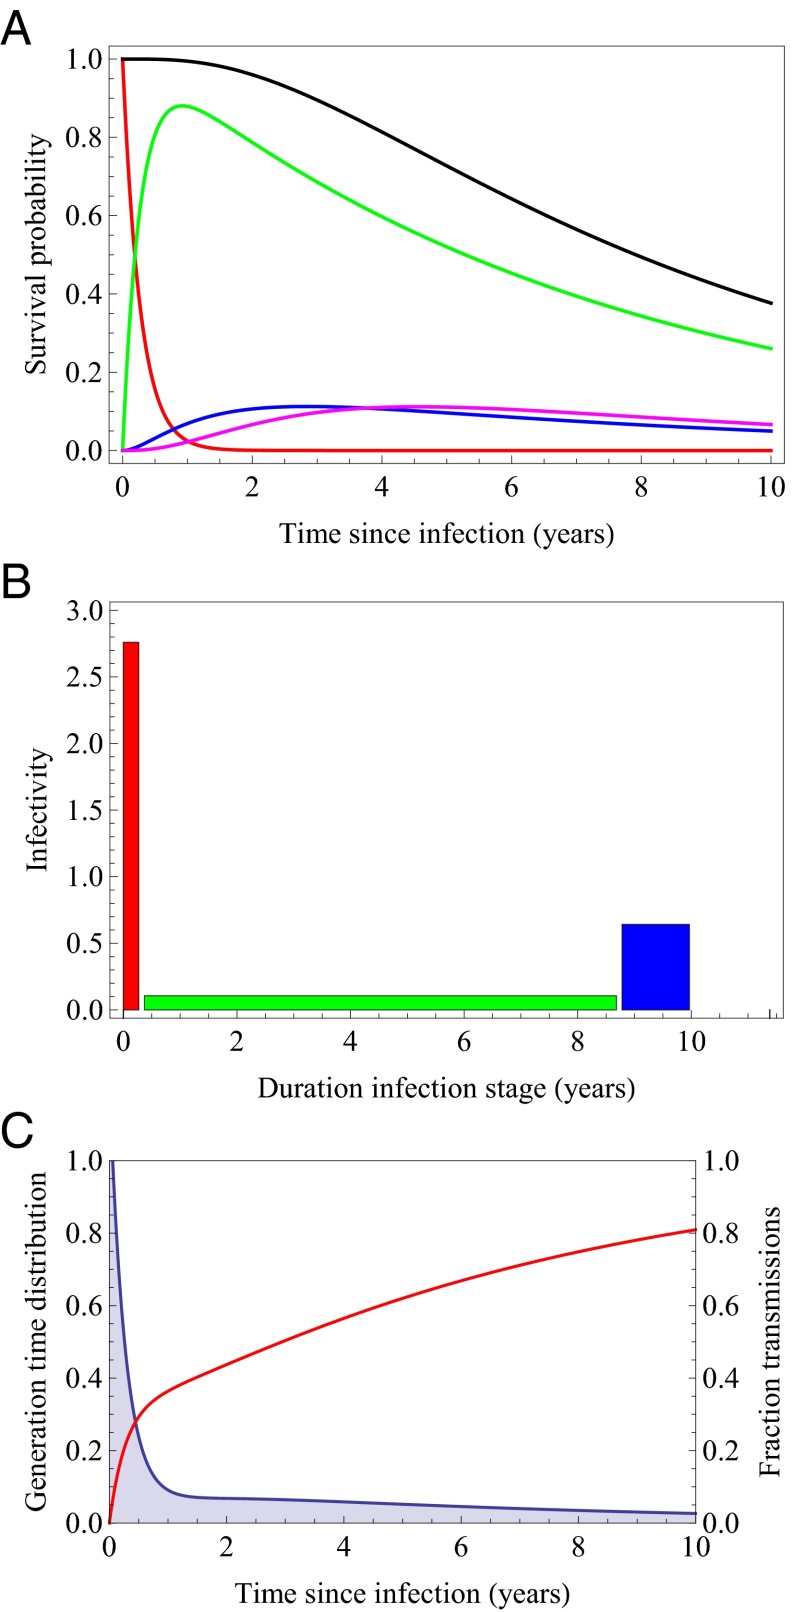
Fig. 2.
(A) Probability of being in a specific stage of infection as a function of time since infection (red: primary infection; green: chronic asymptomatic stage; blue: AIDS mild; magenta: AIDS severe); mean durations are stage 1: 0.271 y; stage 2: 8.31 y; stage 3: 1.18 y; stage 4: 1.32 y. (B) Infectivity of the different stages of infection. Stage 1 (red): 2.76/y; stage 2 (green): 0.106/y; stage 3 (blue): 0.64/y; stage 4 (magenta): 0.0/y. (C) Generation time distribution (blue shaded area) and cumulative fraction of secondary infections (red curve) as a function of time since infection.

