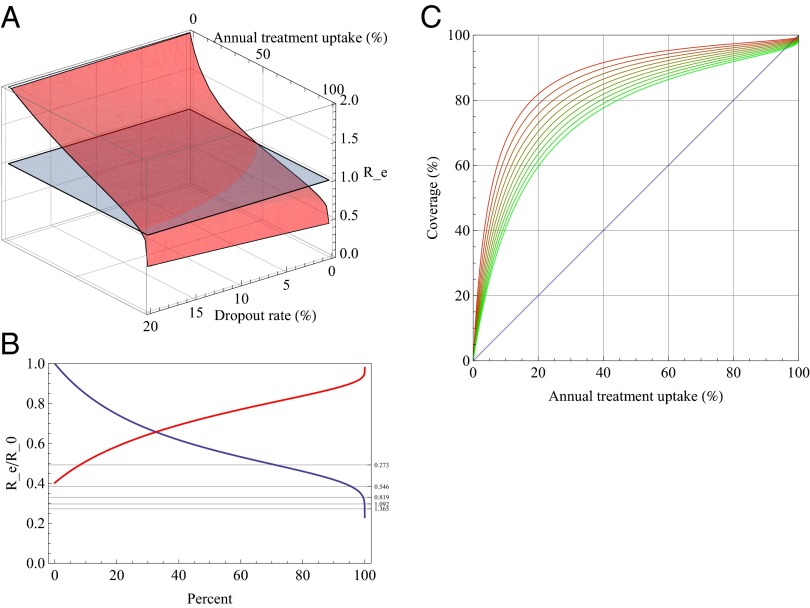
Fig. 4.
(A) Elimination threshold Re as a function of annual treatment uptake and dropout rate for a population with an epidemic growth rate r of 0.273/y. (B) Relative threshold quantity Rf as a function of annual treatment uptake (blue) and dropout rate (red). The respective other parameter is kept constant: the blue curve assumes a dropout rate of 5%; the red curve assumes annual treatment uptake of 80%. Horizontal lines show where the elimination threshold is reached for different values of the exponential growth rate. The uppermost line denotes the threshold for r = 0.273, the lines below for multiples of that value. (C) Relationship between annual treatment uptake and the coverage at a steady state for different values of the dropout rate.

