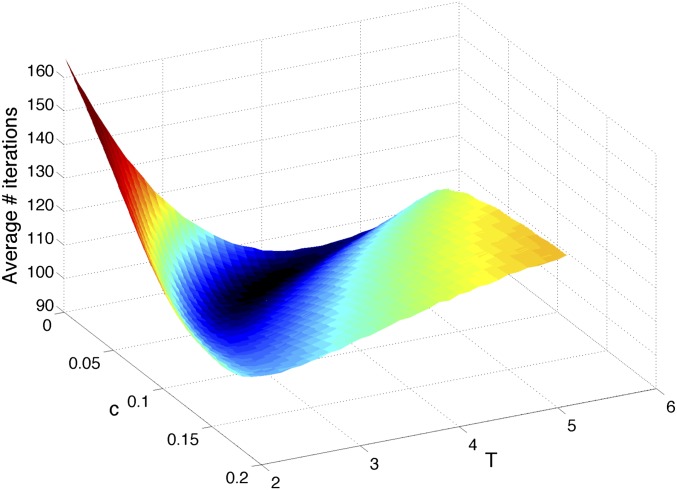
Fig. 4.
The landscape of the average number of iterations required for decision vs.  for the Eq. 12 model. The precision of the decisions is
  and averages are obtained over
  realizations. The parabolic shape makes parameters easy to optimize by evolutionary gradient descent.

