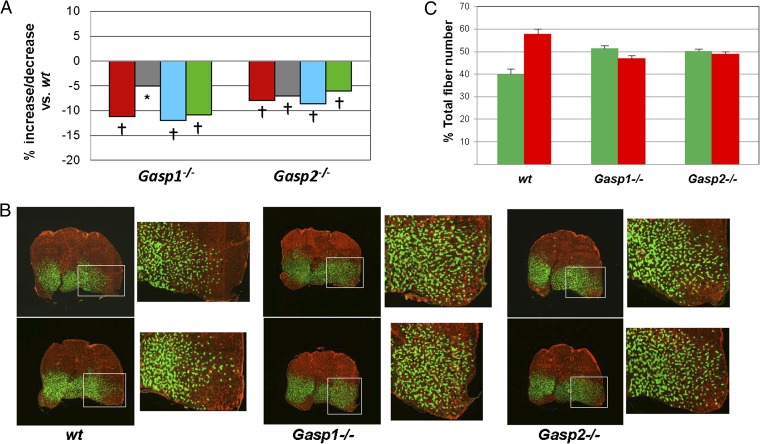
Fig. 4.
Effect of mutations in Gasp1 and Gasp2 on skeletal muscle. (A) Reductions in muscle mass in Gasp1−/− and Gasp2−/− mice. Numbers represent percent increase or decrease in muscle mass relative to WT mice and were calculated from the data shown in Table S4. Muscles analyzed were pectoralis (red), triceps (gray), quadriceps (blue), and gastrocnemius (green). *P < 0.01 vs. WT; †P < 0.001 vs. WT. (B) Fiber type analysis of the gastrocnemius muscle. Note that muscles of Gasp1−/− and Gasp2−/− mice had an increased ratio of myosin heavy chain IIa (green) to myosin heavy chain IIb (red) positive fibers compared with WT mice, which was most evident in the ventrolateral portion of the muscle. The boxed region is shown at higher magnification next to the image of the entire gastrocnemius muscle. (C) Quantification of the ratio of IIa to IIb fibers. Analysis of 2,000 myofibers in the ventrolateral region of the gastrocnemius was carried out for three mice per group. Note the increase in the percentage of IIa fibers in Gasp1−/− (P = 0.014) and Gasp2−/− (P = 0.017) mice and the decrease in the percentage of IIb fibers in Gasp1−/− (P = 0.010) and Gasp2−/− (P = 0.018) mice compared with WT mice. Data are shown as mean ± SEM.

