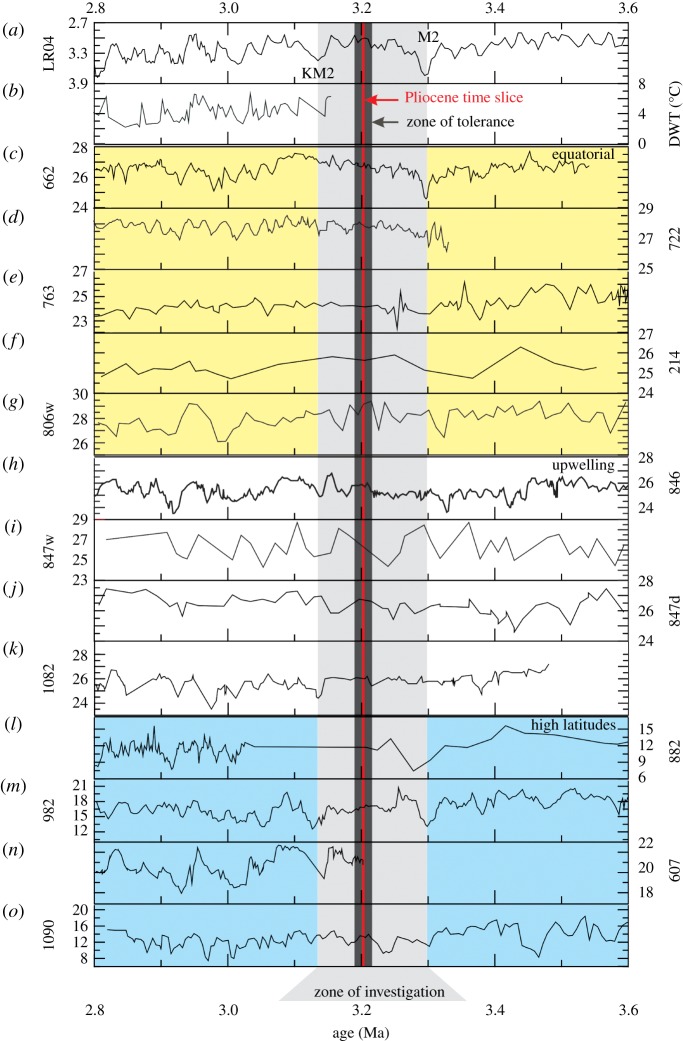
Figure 7.
A compilation of published records of SST that span the late Pliocene and encompass the time slice study proposed here. All SST data are from IODP sites. The red line corresponds to the ideal target identified by the orbital forcing comparison (figure 5). The dark grey shading highlights a broader time window within which SST estimates could be derived and in all probability still reflect conditions during the time slice itself (zone of tolerance). The light grey shading highlights an interval for study to help identify the time slice in marine records, and also to understand climate variability before and after the time slice (zone of investigation). SST records (°C) are compared with (a) the benthic δ18O stack, LR04 [38] and (b) the deep-water temperature reconstruction from the North Atlantic site 607 [57]. Sites: (c) 662, Atlantic [58]; (d) 722, Arabian Sea [58]; (e) 763, Indian Ocean [59]; (f) 214, Indian Ocean [60]; (g) 806, West Pacific [61]; (h) 846, East Pacific [58]; (i) 847, East Pacific [61]; (j) 847, East Pacific [24]; (k) 1082, Southeast Atlantic [62]; (l) 882, Northwest Pacific 882 [63]; (m) 982, North Atlantic [64]; (n) 607, North Atlantic [65]; (o) 1090, Southern Ocean [63].

