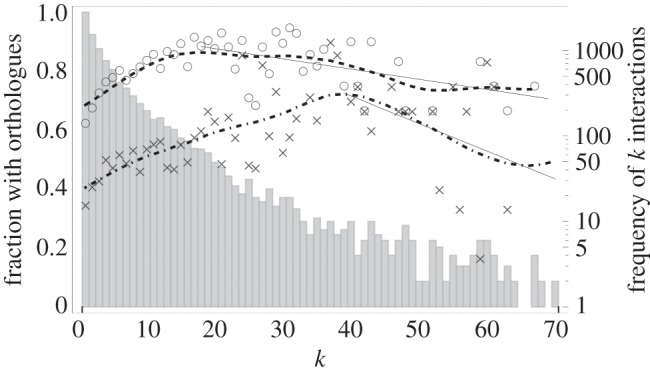
Figure 4.

The fraction of evolutionary conservation of human proteins as a function of their connectivity k. The fraction of conservation is measured as the fraction of proteins that have an orthologous protein in the mouse (circles) and the rat (crosses). The dashed and dot-dashed curves show the trend of the conservation rates compared with mice and rates, respectively. They are calculated using a Gaussian smoothing kernel with a standard deviation of 10 data points. To evaluate the significance of the downward trend of both conservation rates, we performed a least-squares linear regression of the original data points starting from the peaks in the trend lines up to k = 70. For the fraction of orthologues with mice, the slope of the regression line is −0.00347 ± 0.00111 (mean and standard error); with rats, the slope is −0.00937 ± 0.00594. The vertical bars denote the number of proteins with k interactions in the human protein–protein interaction network (logarithmic scale). The data for these plots were kindly provided by Brown & Jurisica [40].
