Figure 1.
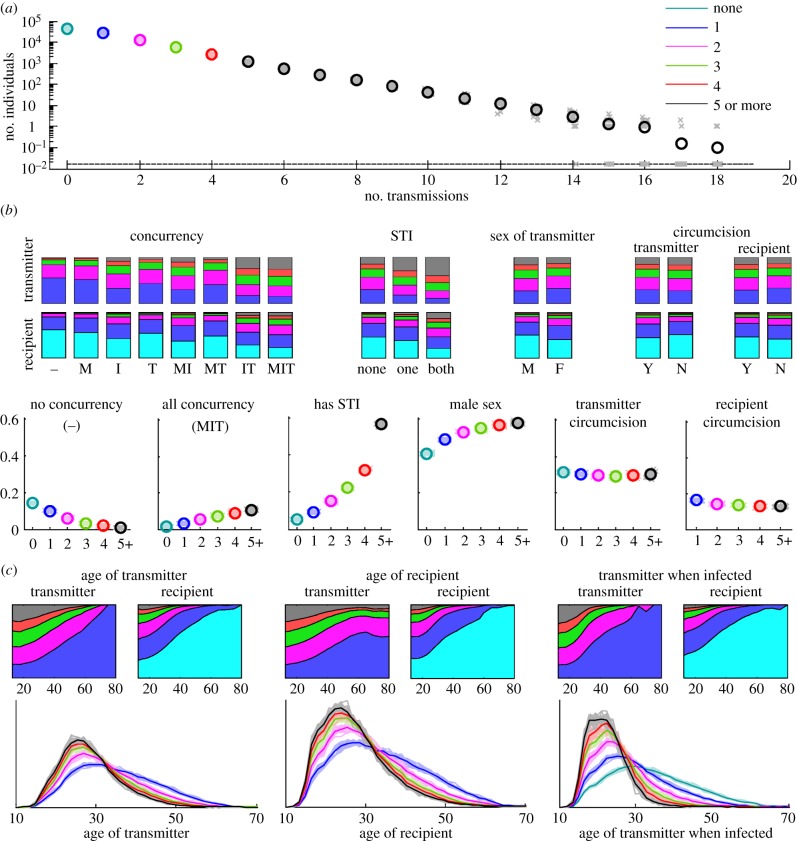
Heterogeneity in HIV transmission potential among individuals in the EMOD-HIV model. (a) The distribution of the number of times an infected individual transmits HIV. Faded x's show individual simulation results, whereas o's show the mean of 20 simulation results. The colours used to plot the number of non-transmitters, single-transmitters, etc. are used for the same transmitter groups in subsequent panels. Next, transmitting couples are categorized based on static properties: the transmitter's concurrency ‘flags’ (marital, informal or transitory), STI status of the transmitter or recipient, sex of the transmitter and circumcision status of a male transmitter or recipient. In (b), the proportions of transmitters and recipients who transmit zero, one, etc. times are shown as stacked bar charts, whereas the proportions of zero, one, etc. transmitters who have the indicated property are shown as individual simulations (x's) and means (o's). Similarly, the stacked area chart in (c) shows the proportion of each age group of transmitters and recipients who transmit zero, one, etc. times, whereas the curves show the age distributions for zero-, one-, etc. transmitters, with faded lines representing single simulations and dark lines showing the mean. These are shown as a function of the transmitter's age, recipient's age and transmitter's age at the time that the transmitter was originally infected.

