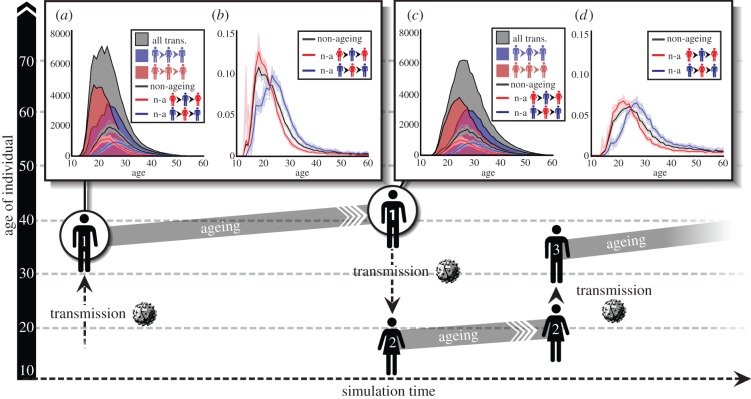
Figure 5.
Number of round trips, NARTs and NARTs per infectious person-year, as a function of age. The diagram illustrates a possible non-ageing male–female–male round trip, with time represented on the horizontal axis and age on the vertical axis. (a) The total number of round-trip transmissions in a simulation, as a function of the age of the first individual in the round-trip chain at his/her time of infection (grey-shaded area). These are disaggregated into male–female–male round trips (blue area) and female–male–female round trips (red area). Below the shading, lines show the subset of these round trips that are non-ageing: male-to-female (blue), female-to-male (red) and all (black). (b) Number of NARTs (of the specified age and sex, as in (a)) per infected sexually active person-year at the sex and age of the first individual's time of infection. (c) Number of total round trips and NARTs, as in (a), as a function first individual's age at the time of transmission. (d) NARTs per infectious person-year, as in (c), as a function of the first individual's age at the time of transmission. Person-years are also calculated for the age at transmission. In (a–d), faded lines show individual simulations and dark lines show the mean of 20 simulations.

