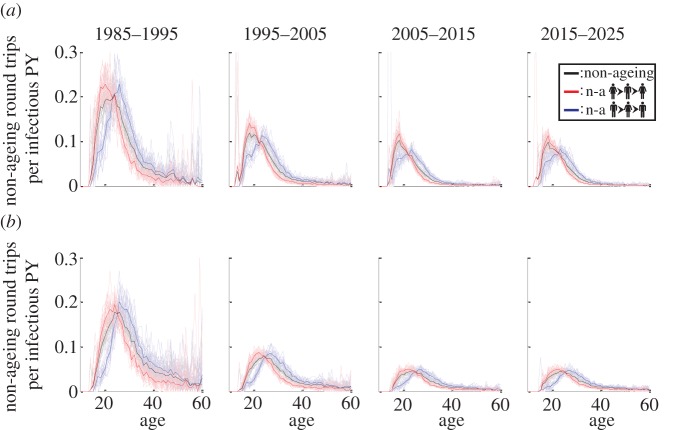
Figure 6.
NARTs by decade. The number of male-to-female (blue), female-to-male (red) and all (black) NARTs per infectious person-year (PY) (of the corresponding age and sex) are plotted as a function of the first individual's age. In (a), age (horizontal axes) and person-years (denominator for vertical axes) are calculated at the age of the first individual during his/her initial infection. In (b), these are calculated at the age of the first individual during transmission. The non-ageing transmission chains are subdivided by decade according to the date of the first transmission. Faded lines show individual simulations and dark lines show the mean of 20 simulations. Although more transmissions per person-year occur in the earlier epidemic, the age pattern remains constant over time.

