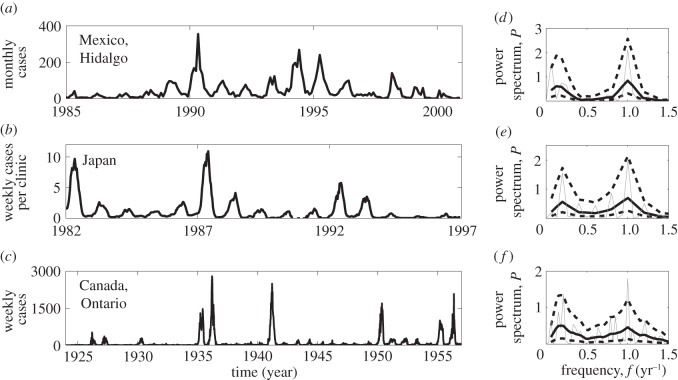
Figure 1.
Time series of the case reports of rubella and the corresponding spectrum in (a,d) the Hidalgo district, Mexico; (b,e) Japan and (c,f) the province Ontario, Canada. To resolve low-frequency periodicities, these time series include short intervals of vaccination (years 1998–2001 for Mexico and 1989–1992 for Japan). Before the spectrum was taken, each series was normalized, setting the mean to zero and the variance to unity. The smooth spectrum (thick black lines) was obtained from the raw spectrum (thin grey lines) using two passes of a three-point moving average of the spectral ordinates. The dashed black lines are 90% confidence limits on the smooth spectrum. The confidence intervals represent the uncertainly in the observations. The method of computation of the spectra and confidence limits is described in detail in [14, ch. 4].

