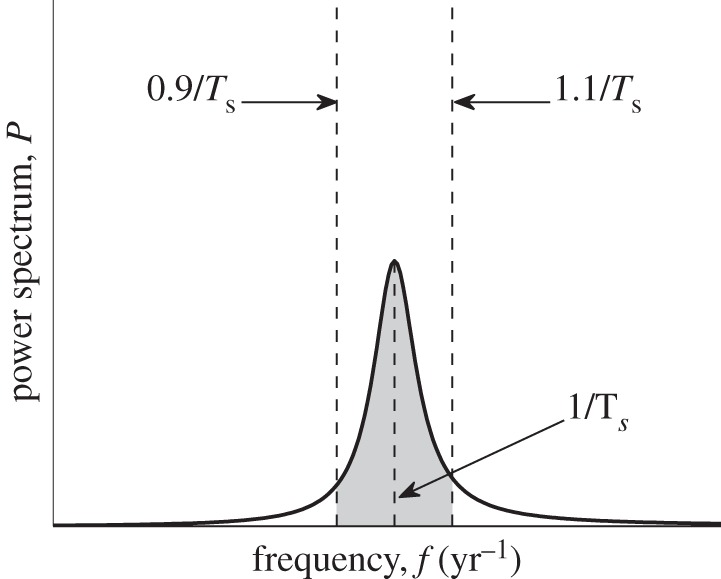
Figure 2.

Schematic plot of a power spectrum of stochastic fluctuations for infectives, P(f). The quantities used in the comparative analysis of different spectra are the dominant period (the inverse of the main peak's frequency), amplification (total area under the power spectrum curve) and coherence (ratio of the shaded area to the total area).
