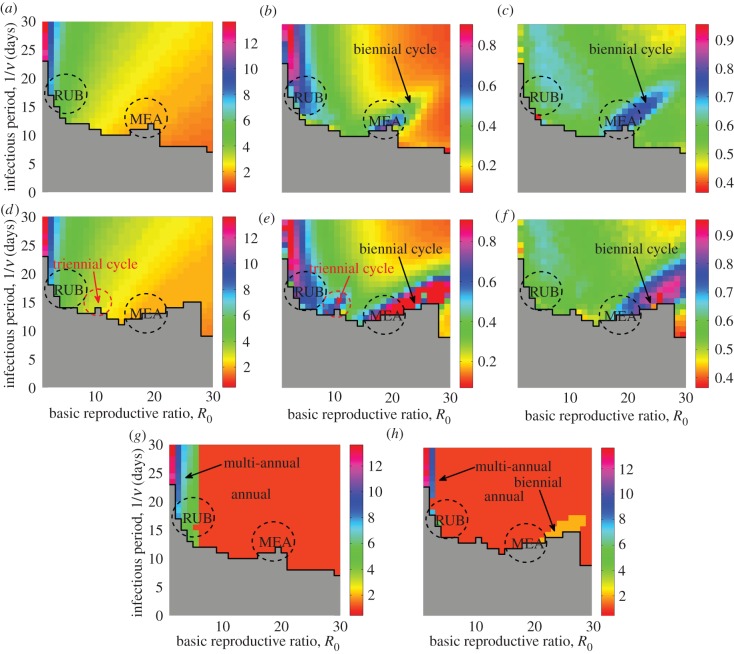
Figure 5.
Simulation results for the (a,d) dominant period of stochastic fluctuations, (b,e) amplification, (c,f) coherence and (g,h) dominant period in the full spectrum. The seasonality is twice larger in the second row and (h) than in the first row and (g). The black stairstep graph bounds the grey region where all simulations went extinction within 500 years. Approximate parameter values for measles and rubella are depicted as dashed circles. Parameters: μ = 0.02 1 y−1, N = 106, (a–c) and (g) ε = 0.05, (d–f) and (h) ε = 0.1.

