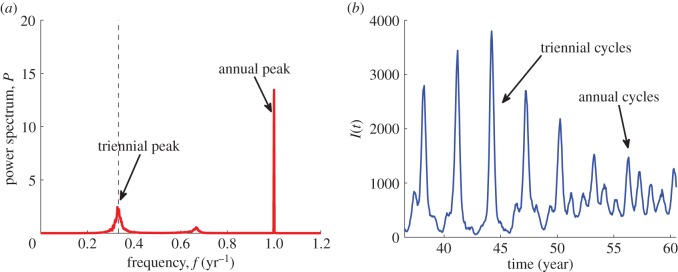
Figure 6.

(a) Full numerical spectrum and (b) typical time series corresponding to the stochastic switching between the annual and triennial cycles in the seasonally forced model. Parameters: N = 106, μ = 0.02 1 y−1, R0 = 11, 1/ν = 15 days, ε = 0.1. The dashed line in (a) indicates the frequency corresponding to the period 3 years. (Online version in colour.)
