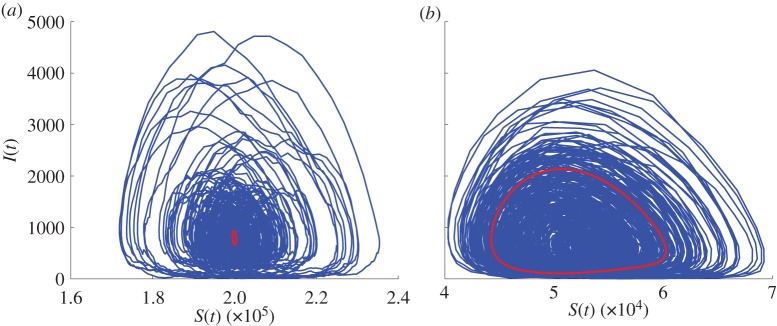
Figure 9.

Typical stochastic trajectories from simulation (blue solid lines) shown in the susceptible–infected plane. The red line is the deterministic annual cycle in (a) and the biennial cycle in (b). For the parameters used in this figure, many simulations go extinct quite fast, for illustration purposes we have chosen the ones which lasted for 500 years. Parameters: N = 106, ε = 0.05, μ = 0.02 1 y−1, (a) R0 = 5, 1/ν = 18 days (close to rubella estimates), (b) R0 = 19, 1/ν = 12 days (close to measles estimates).
