
Figure 2.
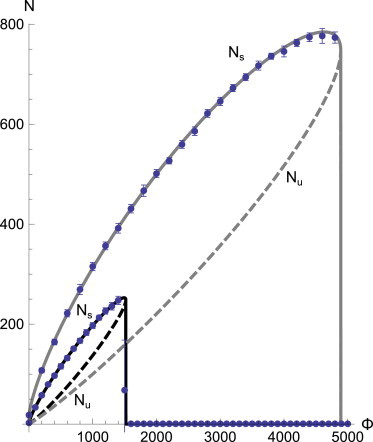
Equilibrium number of bound bonds in a catch-bond cluster as a function of the applied external force Φ. We graph the two solutions branches of d/dt N = 0, and label the stable (solid) and unstable (dashed) branches as Ns and Nu, respectively (see text). Different curves correspond to different values of rebinding rate: (solid curve) γ = 0.1; (shaded curve) γ = 1. Points and the error bars (RMSD for each single simulation trajectory) on these graphs correspond to the data obtained from the Gillespie simulations.