
Figure 6.
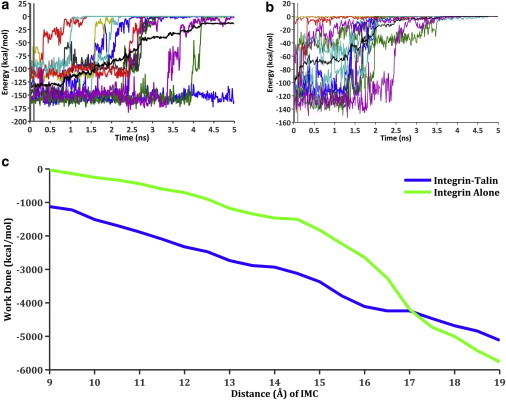
(a and b) Total nonbonding (van der Waals and electrostatic) energy between the IMC residues R995 on the αIIb, and D723 and E726 on the β3 subunits for the steered molecular dynamics (SMD) simulations, where the αIIb R995 carbon-α atom was pulled (k = 0.05 kcal/mol/Å2, velocity = 10 Å/ns) and the β3 D723 and E726 carbon-α atoms were fixed. The colored lines represent the raw data from each of the 12 trials per condition, whereas the dark black line indicates the average of these trials. The two vertical dark gray bars within the first 100 ps indicate the averaged region to obtain the initial nonbonding energy before performing SMD. The graph on the left (a) is the integrin-alone condition, whereas the right (b) is with talin bound to integrin. (c) Work done by the SMD simulations to separate the IMC, as a function of the amount of distance between the carbon-α atoms.