
Figure 5.
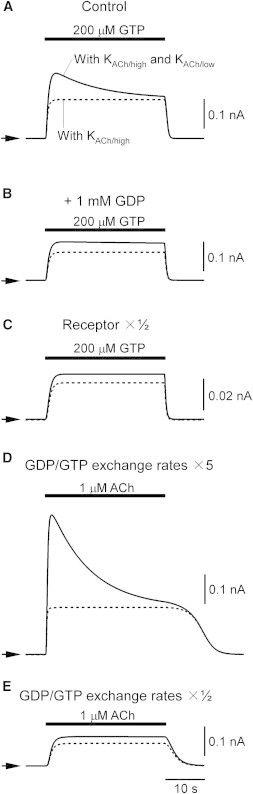
Effect of GDP/GTP exchange on short-term desensitization. (A) Traces of simulated IKACh elicited by 200 μM GTP. The bar above the current traces represents the period of GTP perfusion. To represent basal IKACh activity in the corresponding experimental condition (11), 0.1 μM ACh was applied during the simulation period. IKACh through the KACh/low channel only is shown as a dotted line. The arrowheads indicate the zero current level of each trace. The original values of initial [Rhigh] and [Rlow] were used to represent high receptor expression in the experiments (11). (B) Effect of 1 mM GDP on IKACh induced by 200 μM GTP. IKACh was elicited in the same way as in A except that 1 mM GDP was applied during the entire simulation period. (C) Traces of simulated IKACh elicited by 200 μM GTP with low receptor expression. IKACh was elicited in the same way as in A except that [Rhigh] and [Rlow] were lowered to 50% to represent low receptor expression in the experiments (11). (D) Effect of high GDP/GTP exchange activity on ACh-induced short-term desensitization. GDP/GTP exchange was enhanced by increasing the rate constants for GDP/GTP exchange (k3,4 and k-4,-3) by a factor of 5. The period during which ACh was perfused is shown as a bar above the current trace. (E) The effect of low GDP/GTP exchange activity on ACh-induced short-term desensitization. GDP/GTP exchange was lowered by reducing the rate constants to one-half.