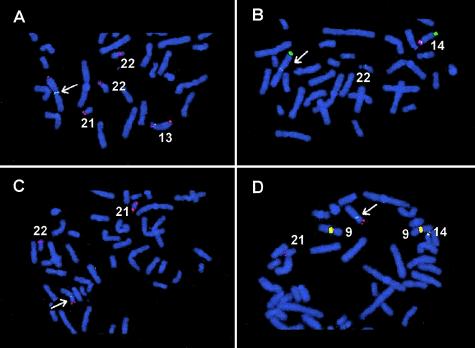
Figure 1.
Partial metaphase spreads showing FISH with specific probes for satellite DNA subfamilies. The Robertsonian translocations are indicated by arrows. The same de novo rob(13q14q) is shown in panels A and B. A, FISH with pTRI-6 (green signals), rDNA (red signals), and a 13q subtelomeric probe (Knight et al. 2000; red signals) shows that the de novo translocation breakpoint is between pTRI-6 (retained) and the rDNA (lost) on chromosome 13. B, FISH with pTRS-47 (green signals), pTRS-63 (red signals), and a 14q subtelomeric probe (Knight et al. 2000; green signals) shows that the translocation breakpoint is between pTRS-47 (retained) and pTRS-63 (lost) on chromosome 14. For panels C and D, the same de novo rob(14q21q) was used. C, FISH with pTRI-6 (green signals), rDNA (red signals), and a 21q subtelomeric probe (Knight et al. 2000; red signals) shows that the translocation breakpoint was between pTRI-6 (retained) and rDNA (lost) on chromosome 21. D, FISH with pTRS-47 (green signals), pTRS-63 (red signals), and a 21q subtelomeric probe (red signals) shows that the translocation breakpoint was between pTRS-47 (retained) and pTRS-63 (lost) on chromosome 14. Note that probes pTRS-47 and pTRS-63 cross hybridize to the pericentromeric region of chromosome 9 (yellow signals).

