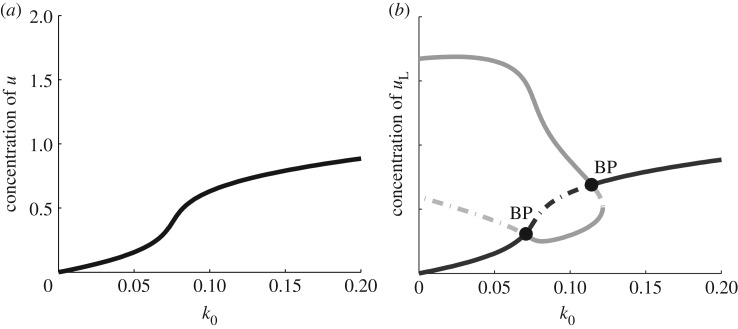
Figure 2.
(a) Bifurcation diagram of the well-mixed WP system (equation (3.2)) with the kinetics (equation (4.1)). The steady-state value of u is plotted with respect to a basal activation rate, k0. Parameter values n = 2, γ = 1, u0 = 1, δ = 1 and total average concentration w = 2.2683. (b) LPA diagram of the WP system (same parameter values). This diagram forms a ‘signature’ for the model. It also provides information about distinct behaviours possible in various parameter regimes. BP indicates a branch point bifurcation. See text for details.

