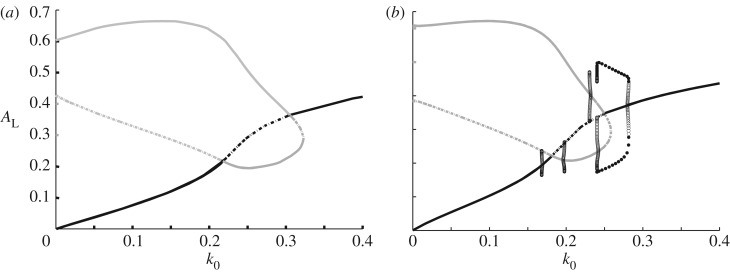
Figure 4.
LPA bifurcation diagram reveals the effect of model extension from WP to WP-F (figure 1a,b). (a) WP system alone, showing active GTPase AL versus basal activation rate k0. Here, F-actin is treated as a parameter (F = 5) in the system (equations (4.3)) with kinetics f(A,I,F) given by equation (4.4). Transcritical bifurcations occur at k0 = 0.2178, 0.3051 (branch points) and fold bifurcation at k0 = 0.3229 (limit point). (b) As in (a) but with F-actin as a dynamic variable. Note new Hopf bifurcations at k0 = 0.169, 0.1963, 0.2318, 0.2419, 0.2799. (The outer two of these are on the global branch.) These indicate presence of oscillatory behaviour. Transcritical bifurcations are seen at k0 = 0.1814, 0.25, and there is a fold bifurcation at k0 = 0.2586. Parameters values: A0 = 0.4, γ = 1.0, s1 = 0.7, s2 = 0.7, T = 1, ε = 0.1, kn = 2.0, ks = 0.25.

