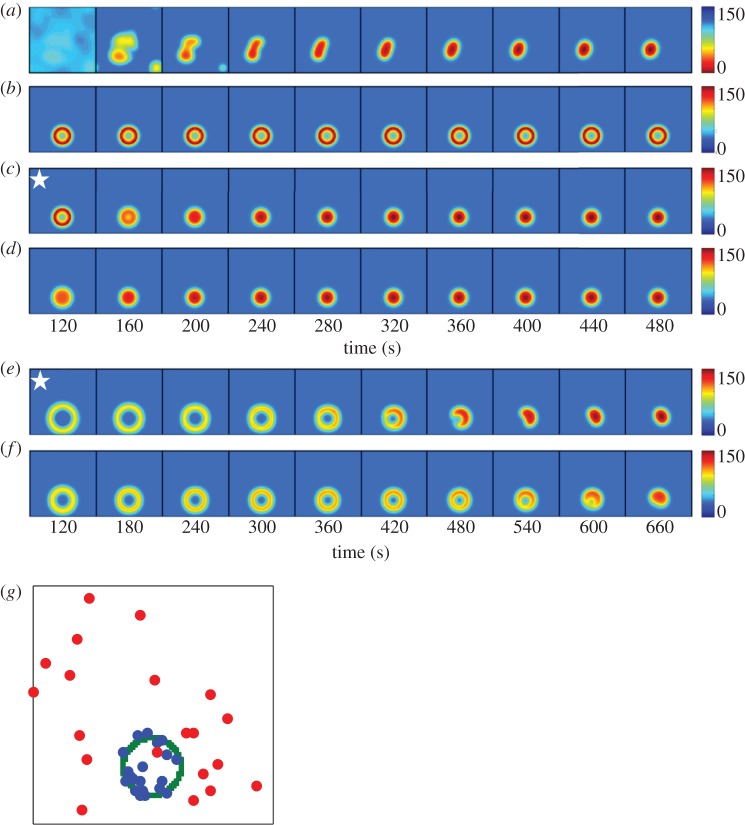
Figure 6.
Modelling polarity establishment in haploids. Each panel represents the concentration of Cdc42 (colour) at the plasma membrane (square) at a particular time (indicated below) after initiating a simulation. (a) Positive and negative feedback loops with noise in the Bem1 complex, no Rsr1–GEF or Rga1–GAP. Because polarity is initiated by noise in this case, each simulation evolves differently. (b) Rsr1–GEF ring added. Rsr1–GEF at 2.5% of total Bem1–GEF. (c) Rsr1–GEF turned off at 120 s (indicated by star). (d) Persistent Rsr1–GEF at 0.025% of total Bem1–GEF. (e) Rga1–GAP plug in the centre of a transient Rsr1–GEF ring. Rsr1–GEF at 2.5% of total Bem1–GEF, turned off after 15 s. Rga1–GAP turned off after 120 s (star). (f) Rga1–GAP plug in the centre of a weak Rsr1–GEF ring. Persistent Rsr1–GEF at 0.025% of total Bem1–GEF. Note longer timescales for (e,f): whereas simulations in (a–d) change little after the last panel, (e,f) continue to evolve towards a single peak. (g) Locations of the Cdc42 peak for 20 simulations of the type shown in (a) (red dots: no Rsr1–GEF) or (f) (blue dots: Rsr1–GEF ring depicted in green). The dots indicate positions with maximum Cdc42 concentration after 1000 s.

