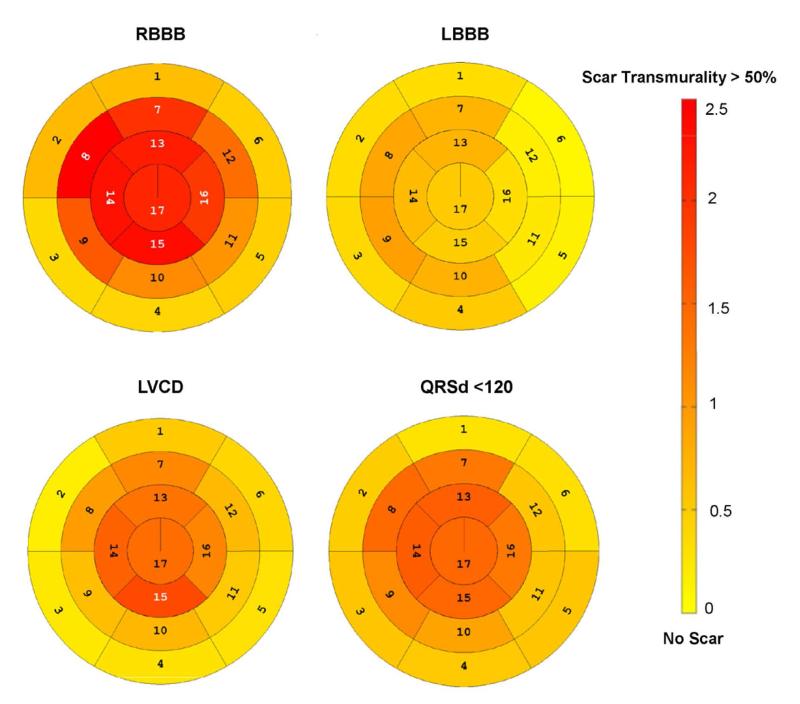
Figure 3. Segmental Scar Distribution in the ICD Cohort.
Polar plots show the average transmural scar extent within each of the 17 AHA defined myocardial segments graded on a 0-4 point scale (0 for 0% hyperenhancement, 1 for 1-25% hyperenhancement, 2 for 26-50% hyperenhancement, 3 for 51-75% hyperenhancement and 4 for 76-100% hyperenhancement) (17). The figure is scaled from no scar (light yellow) to a transmural scar grade of 2.5 (dark red). Note that the right bundle branch runs through segment 8 (mid anteroseptal), which had the highest scar grade of any segment in RBBB patients.

