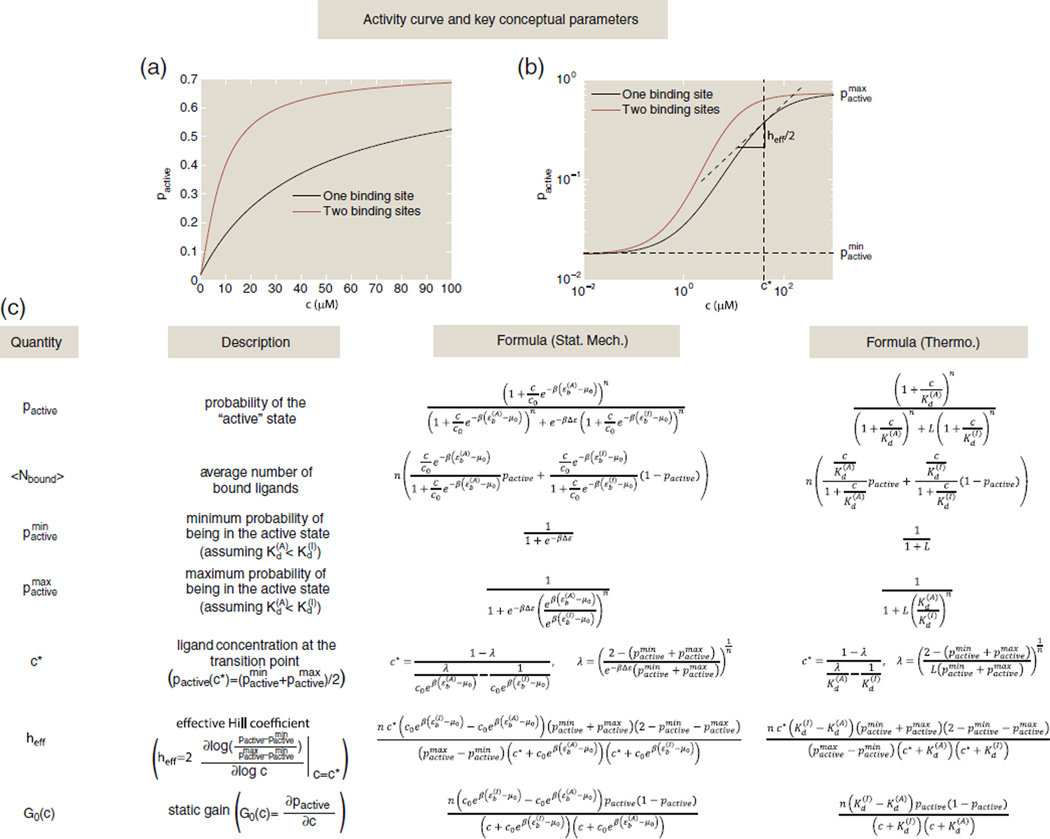
Fig. 2.
Table of key quantities that can be computed within the MWC framework. (a) The activity curve on a linear scale for two MWC molecules: a one-site receptor with Δε = εI − εA = −4 kBT, and , giving a difference in binding energy of ; and a two-site receptor with Δε = εI − εA = −4 kBT, , and , giving a binding energy difference of . (b) The activity curves from (a) with concentrations on a log scale. The transition point concentration c* = 40.6 µM and effective Hill coefficient heff = 1 are shown with vertical and horizontal lines, respectively, for the one-site receptor. (c) This table gives formulas for some of the key parameters of interest in both statistical mechanics and thermodynamic language. Here, n is the total number of binding sites on the receptor, L = e−βΔε is the conformational equilibrium constant where Δε = εI − εA is the difference in conformational energy between the inactive and active state, is the inactive state's dissociation constant for ligand binding, is the active state's dissociation constant for ligand binding and c is the ligand concentration.

