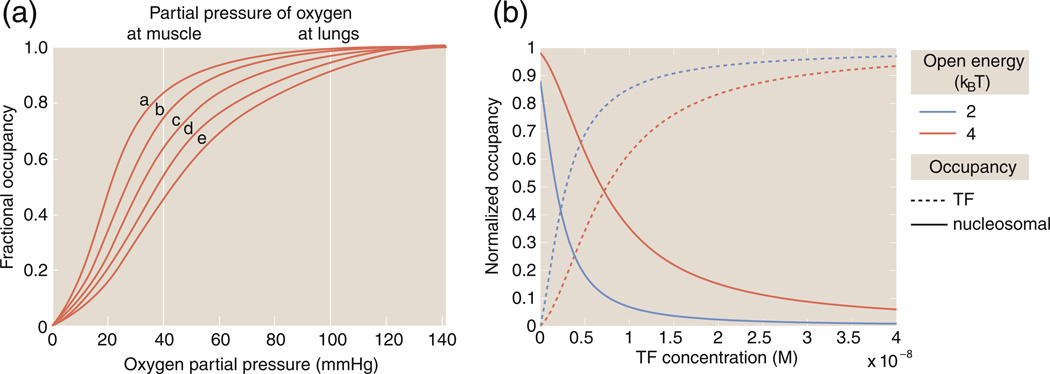
Fig. 8.
The Bohr effect and MWC models. (a) The Bohr effect and oxygen binding to hemoglobin as a function of pH. The hemoglobin binding curves are shown for five values of the pH: (a) 7.5, (b) 7.4, (c) 7.2, (d) 7.0 and (e) 6.8. The vertical lines indicate the partial pressures experienced in muscle and in the lungs. (b) The “Bohr effect” in the context of chromatin showing how the occupancy of a transcription factor on nucleosomal DNA changes as the histone–DNA affinity (for example) is changed, as described in Eq. (11). For the figure shown here, we have and . The closed state energy has been chosen as the reference energy and is taken as zero.

