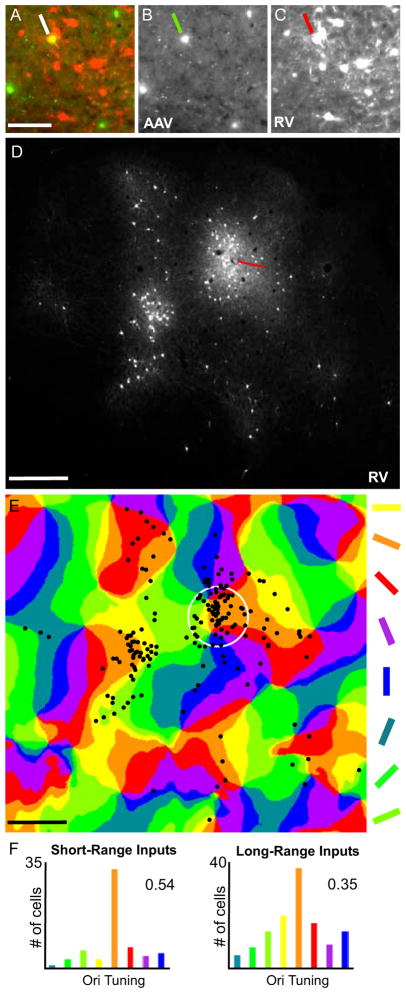
Figure 6. Correlating Orientation Preference of Inputs to V1 Inhibitory Neurons in Cat.
(A) As shown in the high magnification image of a superficial section of flattened V1 cortex, AAV/GAD1/YTB transduction (green) allowed for initial infection with the EnvA-ΔG-RV-mCherry creating a double-labeled starter cell (yellow; indicated by the white line) and leading to RV spread to presynaptically connected neurons (red). AAV/GAD1/YTB and EnvA-ΔG-RV-mCherry infected neurons are shown separately in (B and C). In (D), the pattern of EnvA-ΔG-RV- mCherry infected neurons is shown in the low magnification image of a superficial section of flattened V1 cortex adjacent to that shown in (A–C). A reconstruction of this pattern is overlaid on the orientation preference map in (E). The numbers of cells present in each colored domain in (E) were counted for short- (within the white circle) and long-range intrinsic distances and displayed in the histograms in (F). Corresponding orientation selectivity index (OSI) values of 0.54 and 0.35 calculated using the formula provided in Supplemental Information are also given. The red line in (D) points to the location of the EnvA-ΔG-RV-mCherry injection site. The white circle in (E) represents a 250 μm radius around the approximate center of the location of the starter cell identified in (A). Scale bars = 100 μm in (A), and 500 μm in (D and E). See also Fig. S5.

