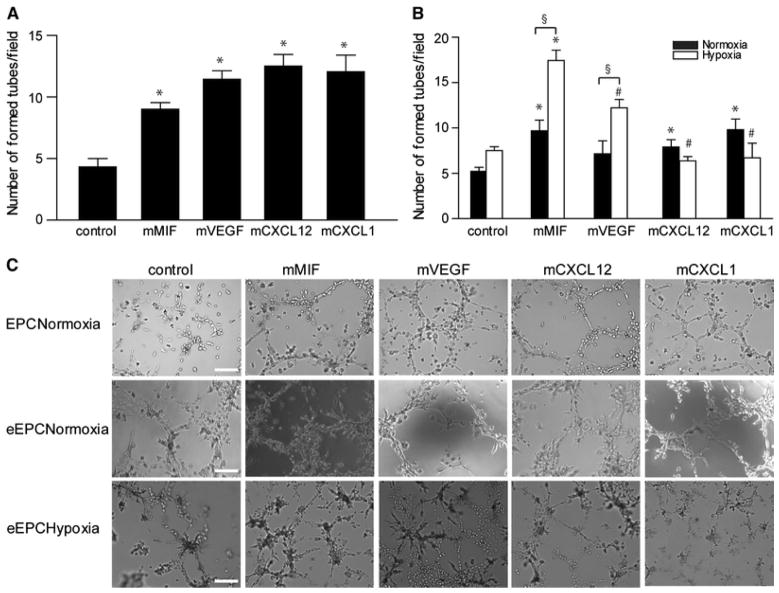
Figure 3.
Comparison of the tube formation potential of the angiogenic factors/chemokines in vitro. Tube formation was evaluated in Matrigel matrices containing (e)EPCs/SVECs cell suspensions. a Number of formed tubes in vitro by EPCs under normoxic conditions after 24 h (*p < 0.05 vs. control; n = 6). b Embryonal EPC-mediated tube formation assay in vitro under normoxia versus hypoxia after stimulation with MIF, VEGF, CXCL12 or CXCL1 for 24 h (*p < 0.05 vs. respective control, § p < 0.05 vs. normoxia at the respective stimulation condition, # p < 0.05 vs. MIF in hypoxia; n = 4). c Representative images from each group (scale bar 50μm)

