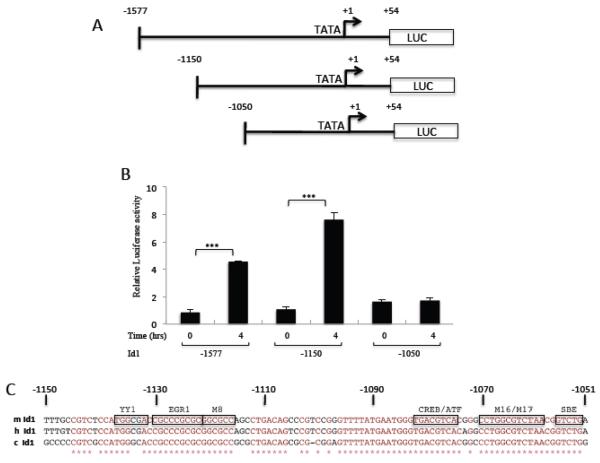
Figure 3. Mapping the Serum regulation element of the mId1 promoter.
A) Map of mouse Id1 promoter deletion mutants. B) NIH3T3 cells were transfected with variants of the Id1 promoter along with pRLSV40P as an internal control. The next day transfected cells were starved in 0.2% serum overnight and then induced with 20% serum for four hours. Firefly luciferase levels were normalized to the Renilla pRLSV40P levels and are the means of three experiments +/− the standard deviation. *** indicates a p-value ≤ 0.05. C) Conservation of sequence elements in the conserved 100 bp Id1 promoter region −1150 to −1050. m, mouse; h, human; c, chicken. M8 and M16/M17 indicated mutated regulatory elements from reference [43].

