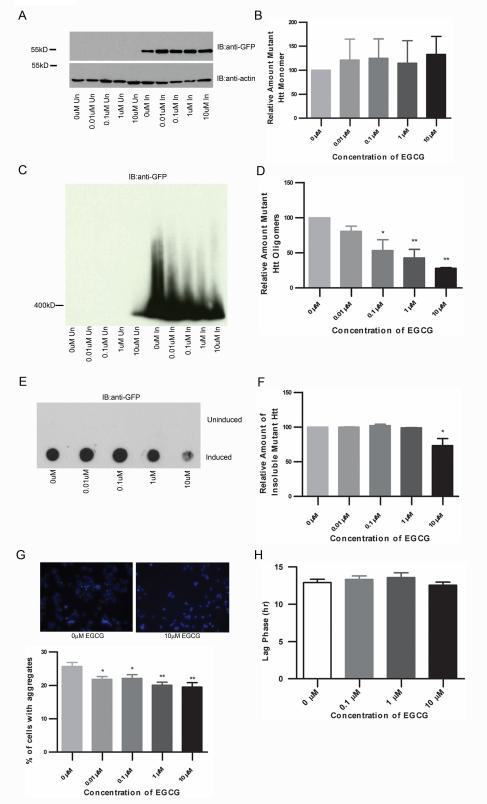
Figure 4. EGCG decreases oligomers and SDS-insoluble Htt in a stably expressing truncated Httex1p model of HD.
A-F, 14A2.6 cells were treated with EGCG at the concentrations listed for 48 hours. Cells were lysed and analyzed for different conformations of mutant Htt. A-B, SDS-PAGE analysis of lysates shows no significant difference in monomeric Htt (one-way ANOVA: F= 0.1567, P=0.9545). C-D, There is a dose-dependent decrease in the level of mutant Htt oligomers (one-way ANOVA: F= 9.551, P=0.0019; Dunnett’s multiple comparison test: 0μM vs. 0.01μM P=n.s., 0μM vs. 0.1μM P<0.05, 0μM vs. 1μM P<0.01, 0μM vs. 10μM P<0.01). E-F, EGCG treatment decreases the amount of SDS-insoluble mutant Htt (one-way ANOVA: F= 6.623, P=0.03; Dunnett’s multiple comparison test: 0μM vs. 0.01μM P=n.s., 0μM vs. 0.1μM P=n.s., 0μM vs. 1μM P=n.s., 0μM vs. 10μM P<0.05). G, 14A2.6 cells were treated with EGCG at the concentrations listed for 48 hours. Cells were then fixed and the number of cells containing aggregates was counted by fluorescence microscopy. EGCG treatment significantly decreases the percentage of cells containing at least one visible aggregate (one-way ANOVA: F= 4.579, P=0.0019; Dunnett’s multiple comparison test: 0μM vs. 0.01μM P<0.05, 0μM vs. 0.1μM P<0.05, 0μM vs. 1μM P<0.01, 0μM vs. 10μM P<0.01). H, EGCG treatment does not appear to affect aggregation kinetics (one-way ANOVA: F= 0.8071, P=0.4927).

