
Fig. 2.
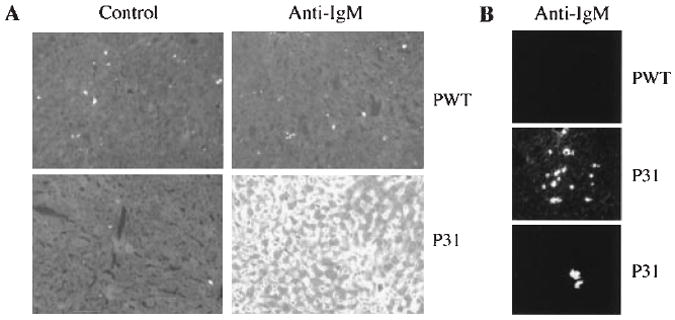
Tolerance breakdown results in massive IgM accumulation in the liver. (A) Frozen sections of livers taken 4 days after immunization were stained with FITC-conjugated anti-IgM or control antibody (rat IgG2a, κ). Photos were taken at 200× magnification with 5-s exposure. (B) Similar staining as in (A), showing clusters of B cells; photos were taken at 1-s exposure. This exposure preferentially reveals antibody-forming cells. The two lower panels are images from different mice.