
Figure 4.
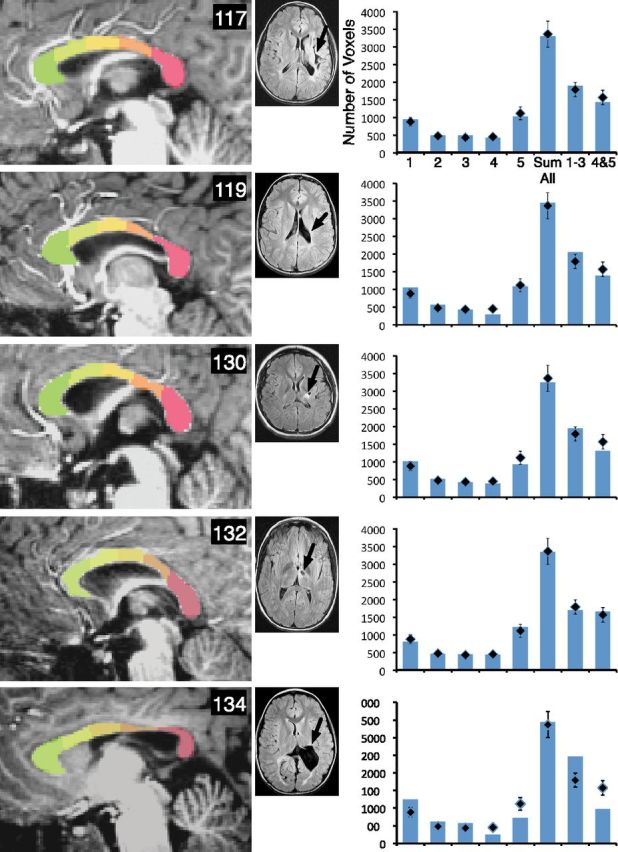
The corpus callosum displays segment-specific atrophy consistent with the site of injury. Parcellation of the corpus callosum is shown for each member of the early group, including 117, 119, 130, 132, and 134, and T2-weighted FLAIR axial magnetic resonance scans are shown for each person with injury. Black arrows show the primary site of the lesion. In the accompanying graphs, diamonds show the average volume for the typical group for each segment, for the sum of all segments, for the anterior segments, and for the posterior segments. Bars represent these volumes for each person with early injury. Error bars represent the SEM for the typical control group.