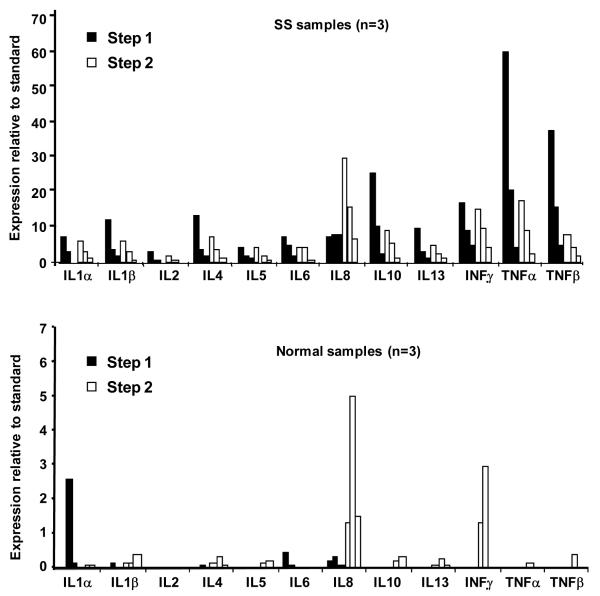
Figure 4.
Top Panel: Normalized expression levels of SS samples (n=3) using step one and step two assays shown with black and white bars, respectively. Bottom Panel: Normalized expression levels of normal samples (n=3) using step one and step two assays, shown with black and white bars, respectively.

