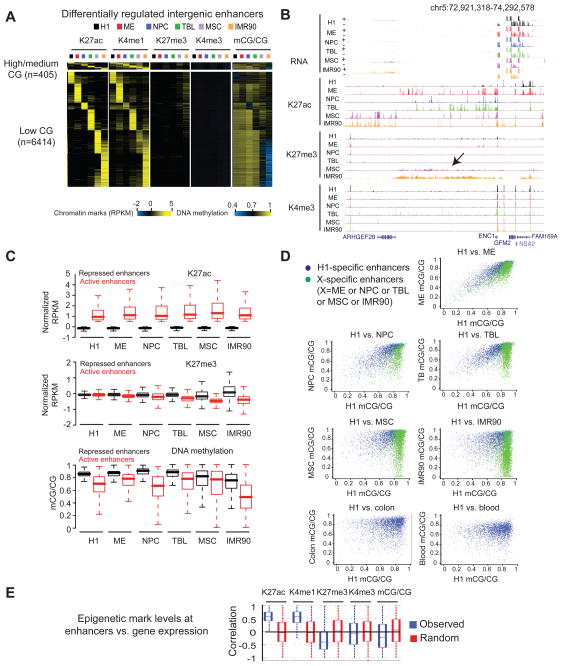
Figure 4. Epigenetic regulation of lineage-restricted enhancers.
(A) Heatmaps showing the average levels of H3K27ac, H3K4me1, H3K4me3, H3K27me3, and DNA methylation around the centers of lineage-restricted enhancers. Histone modifications, enhancer center +/− 2kb; DNA methylation, enhancer center +/− 500bp; CG density, enhancer center +/− 500bp. (B) The epigenetic landscape at an intergenic locus showing a low level of H3K27me3 and absence of H3K27ac in MSC and IMR90. (C) Boxplots showing the levels of H3K27ac (top), H3K27me3 (middle) and DNA methylation (bottom) at active and repressed enhancers in each cell type. (D) Scatterplots showing the levels of DNA methylation in each cell type at H1-specific enhancers (blue) and differentiated cell-specific enhancers (green). In the last two panels, colon- and blood-specific enhancer information (green dots) is not available in (Berman et al., 2012; Li et al., 2010). (E) Boxplots showing the distribution of Pearson correlation coefficients between the levels of various histone modifications or DNA methylation at enhancers and the expression level of their potential target genes. See also Figure S4.

