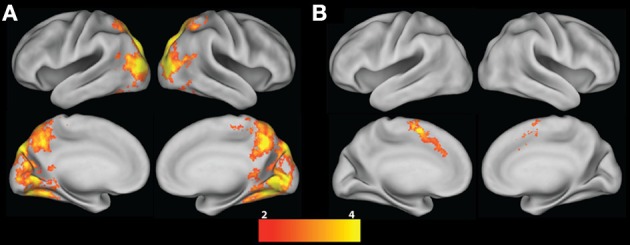
Figure 3.

Risky choice contrast. (A) ART vs. BART group contrast; (B) BART vs. ART group contrast. All contrasts are corrected for whole-brain multiple comparisons; statistical maps were projected onto an average cortical surface using CARET (Right hemisphere = Right side of the image). The color scale represents z-score.
