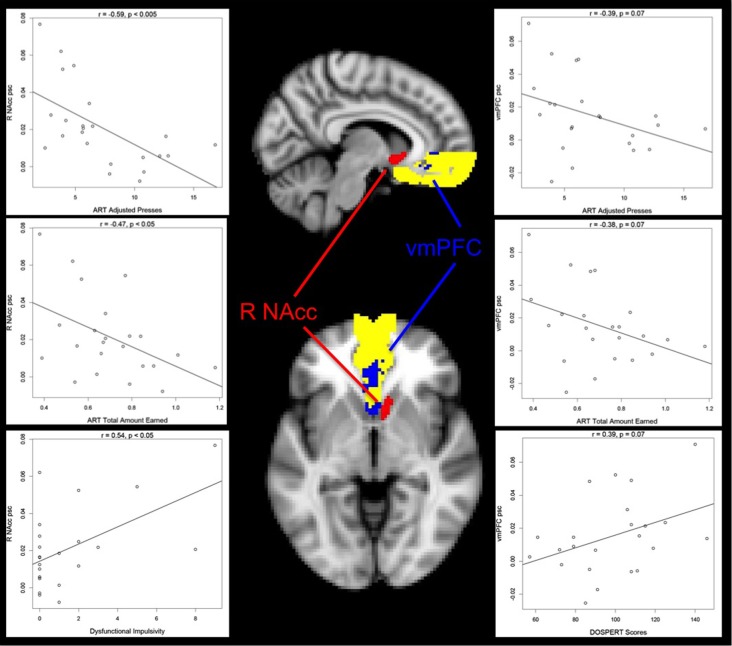
Figure 5.
Relationship between risk-taking performance, impulsivity, risk-taking propensity and Risky choice Parametric activation. Average percent signal change (psc) values extracted from the right nucleus accumbens (R NAcc) negatively correlate with ART average Adjusted Presses (top left panel) and Total Amount Earned (middle left panel), and positively correlate with Dysfunctional Impulsivity scores (bottom left panel), suggesting that increased reward-tracking activation is associated with poorer performance on the ART and higher impulsivity. A similar pattern is seen in average percent signal change (psc) values extracted from the ventromedial prefrontal cortex (vmPFC), although at trend level: vmPFC activation negatively correlates with ART average Adjusted Presses (top right panel) and Total Amount Earned (middle right panel). vmPFC activation also marginally positively correlates with DOSPERT scores (bottom right panel), suggesting that increased reward-tracking activation is associated with a greater likelihood of engaging in risky behaviors. Activation represents the ART Risky choice Parametric contrast as intersected with our two anatomical ROIs, as described in the text. The vmPFC anatomical mask is presented in yellow, and significant ART Risky choice Parametric activation within this mask is presented in blue. ART Risky choice Parametric activation overlapped with the entire R NAcc mask: these voxels are presented in red. R = Right. For the sagittal view, X = 41; for the axial view, Z = 34.

