
Figure 5.
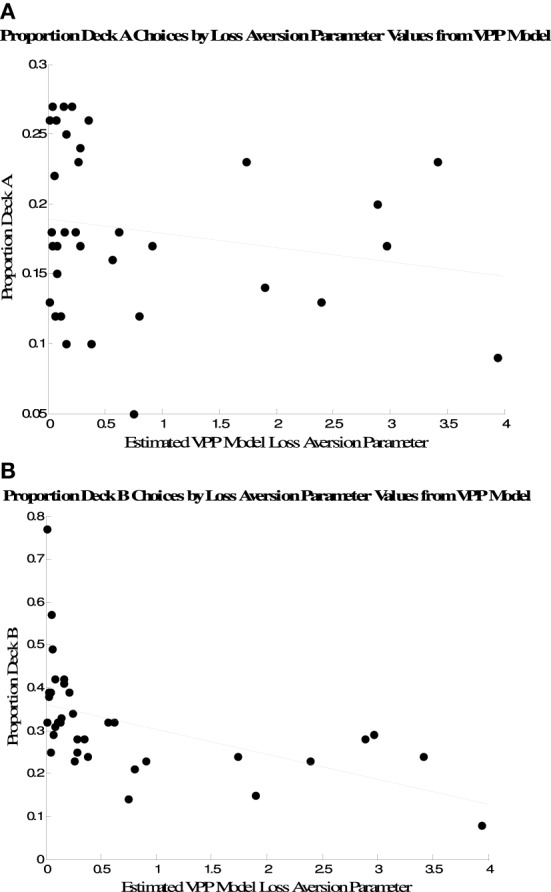
Association between Deck A selections (A) and Deck B selections (B) and individual posterior modes of loss aversion parameter distributions from the VPP model.
Official websites use .gov
A
.gov website belongs to an official
government organization in the United States.
Secure .gov websites use HTTPS
A lock (
) or https:// means you've safely
connected to the .gov website. Share sensitive
information only on official, secure websites.
Association between Deck A selections (A) and Deck B selections (B) and individual posterior modes of loss aversion parameter distributions from the VPP model.