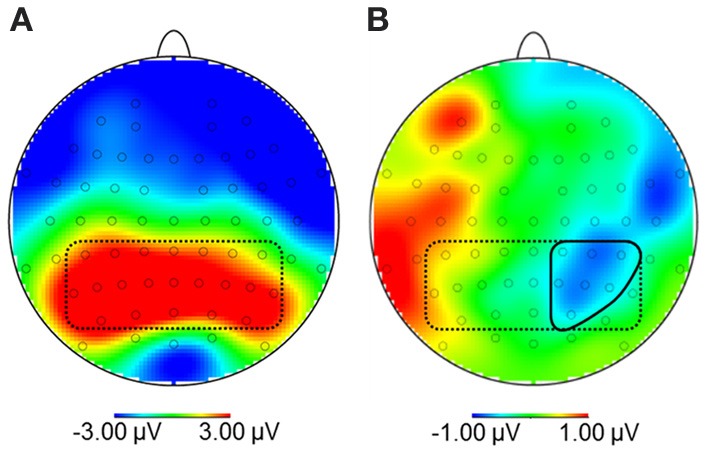
Figure 3.

(A) Topography of maximal amplitudes of the Late Positive Potential between 350 and 550 ms (encircled by dotted line). (B) Within this region, sensors where the difference for high-calorie food pictures after the NOW vs. LATER perspective was maximal were collapsed (CP2, CP4, CP6, P2, P4, P6, PO4; encircled by solid line).
