
Figure 6.
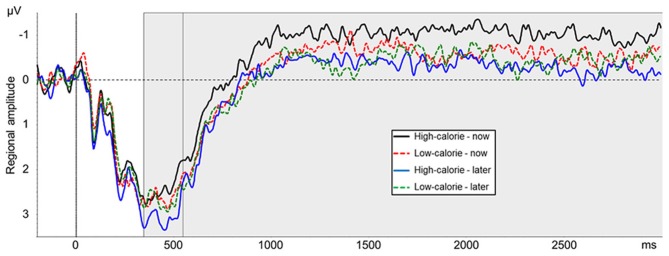
Mean amplitude of pooled ERPs of a centro-parieto-occipital cluster (CP2, CP4, CP6, P2, P4, P6, PO4). Gray shaded boxes mark time windows between 350–550 ms and 550–3000 ms.
Official websites use .gov
A
.gov website belongs to an official
government organization in the United States.
Secure .gov websites use HTTPS
A lock (
) or https:// means you've safely
connected to the .gov website. Share sensitive
information only on official, secure websites.
Mean amplitude of pooled ERPs of a centro-parieto-occipital cluster (CP2, CP4, CP6, P2, P4, P6, PO4). Gray shaded boxes mark time windows between 350–550 ms and 550–3000 ms.