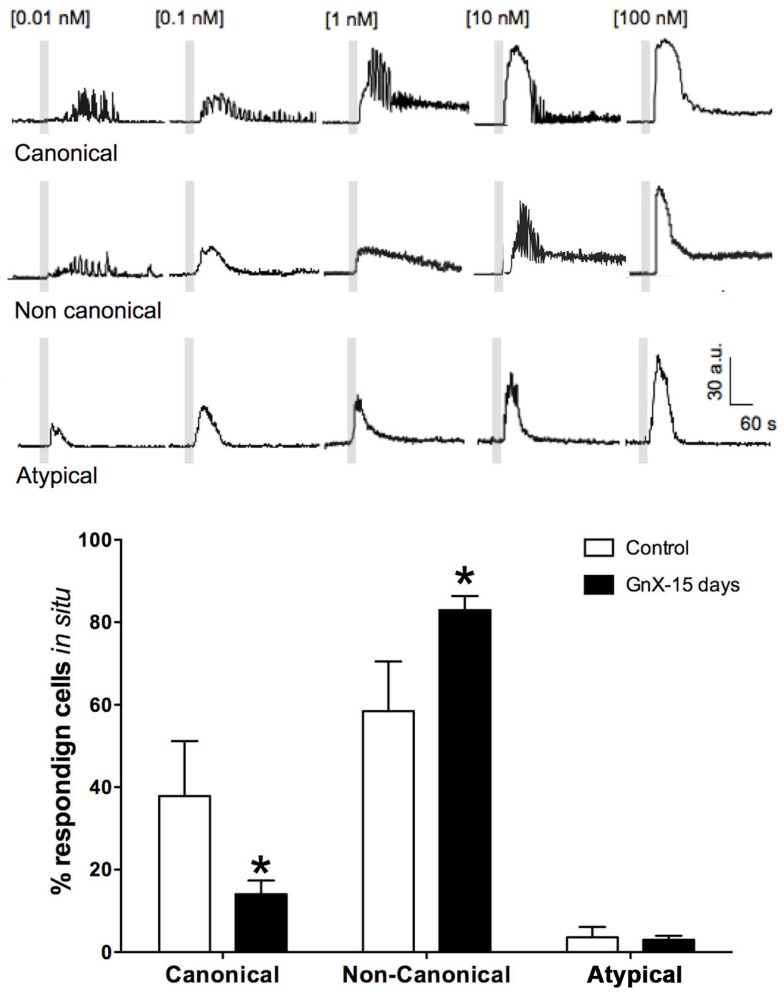
Figure 3.
Percentage of gonadotrophs that display different GnRH dose-response intracellular Ca2+ signaling patterns rises in response to increasing GnRH: canonical ([Ca2+]i oscillations of increasing frequency at low-medium GnRH concentration and spike-plateau at saturating GnRH concentration), non-canonical (disordered sequence of oscillatory and spike-plateau [Ca2+]i signals in response to increasing GnRH concentrations), and atypical (non-oscillatory, transient [Ca2+]i); open bars represent data from intact mice and black bars those of castrated mice after 15 post-GnX. After orchidectomy, non-canonical responses increased, while the fraction of cells with canonical responses declined. Differences between intact and post-GnX, for both canonical and non-canonical responses are significant. *p < 0.05 versus the control (two way ANOVA with Bonferroni post hoc test). Parts of this figure were originally published in Durán-Pastén et al., (145).

