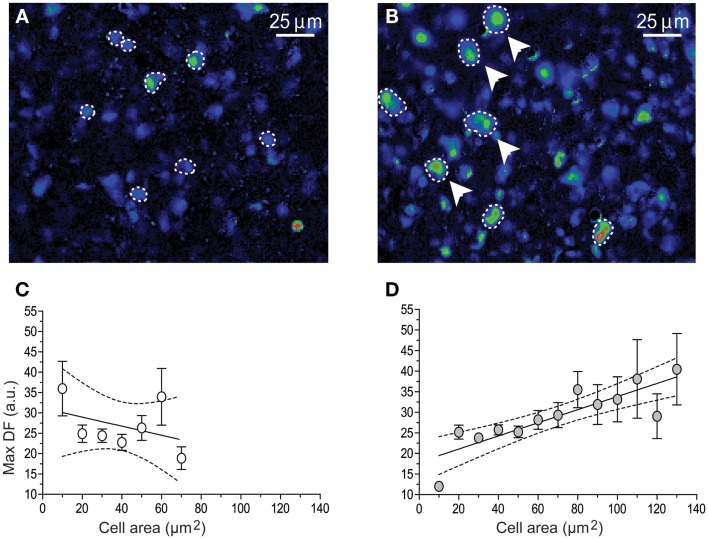
Figure 4.
Graphs illustrating the relation between gonadotrophs area size versus the peak amplitude of GnRH-induced Ca2+ transients. Fluo-4 fluorescence images of 100 nM GnRH responding gonadotrophs (dashed lines) in intact (A) and 15 days post-GnX (B) mice pituitary slice, arrows pointed bigger gonadotrophs. (C,D) shows the relationship between [Ca2+]i transients peak amplitude (Max DF) and cell area (Mean ± SE). (C) Intact (n = 6) and (D) 15 days post-GnX (n = 6) mice pituitary slices are represented; dashed line represent the confidence interval. (C) y = −0.11* ± 0.11x + 31.1 ± 5.1, R2 = 0.15, p > 0.05, Pearson r = 0.38, p > 0.05 and (D) y = 0.16* ± 0.02x + 17.88 ± 2.3, R2 = 0.73, p < 0.05, Pearson r = 0.85, p < 0.05. Parts of this figure were originally published in Durán-Pastén et al., (145).

