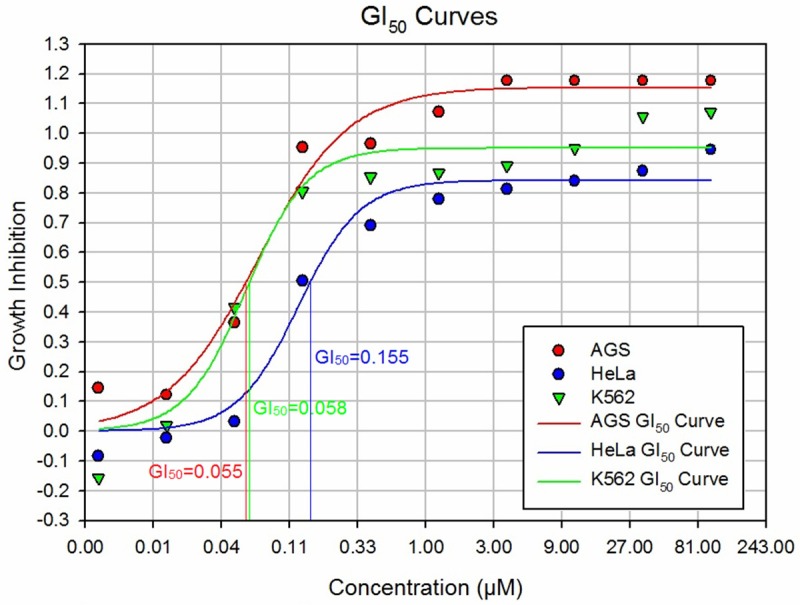
Figure 3.

Growth inhibition curves and GI50 values for compound C505. Nine different concentrations of C505 were used to treat three different cancer cell lines for 72 hours to establish growth inhibition curves (plots of growth inhibition by compound concentration). The GI curves allow the estimation of GI50 value, which is the compound concentration required to achieve 50% inhibition.
