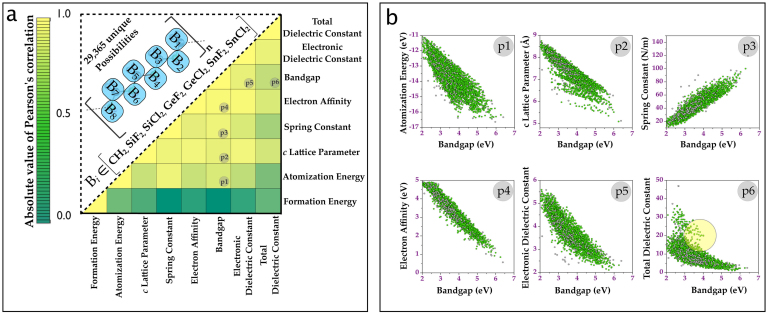
Figure 3. High throughput predictions and correlations from machine learning.
(a) The upper triangle presents a schematic of the atomistic model composed of repeat units with 8 building blocks. Populating each of he 8 blocks with one of the seven units leads to 29,365 systems. The matrix in the lower triangle depicts the Pearson's correlation index for each pair of the eight properties of the 8-block systems predicted using machine learning. (b) Panels p1 to p6 show the correlations between the band gap and six properties. The panel labels are also appropriately indexed in (a). The circle in panel p6 indicates systems with a simultaneously large dielectric constant and band gap.

