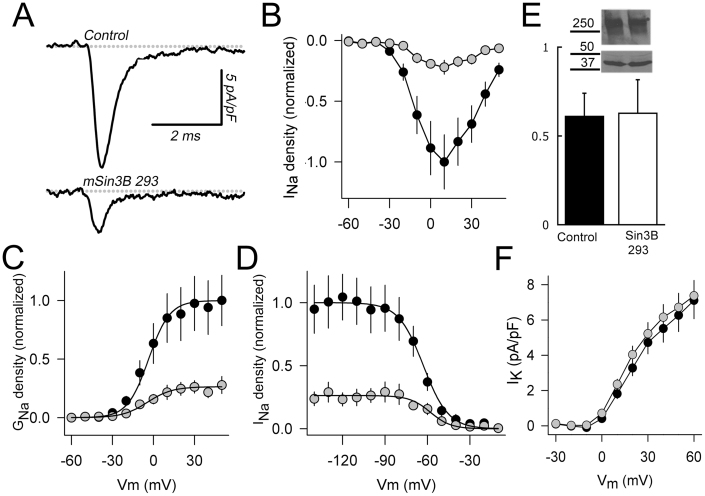
Figure 6. Sin3B reduces native sodium currents in N1E-115 neuroblastoma cells.
(A) Typical sodium currents recorded under voltage-clamp in transfected N1E-115 cells. Currents were elicited by depolarizing steps from a holding potential of −80 mV to +40 mV. Upper trace: control cell, expressing DsRed alone. Lower trace: cell expressing Sin3B 293 and DsRed. (B) Current-Voltage relationship. Sodium currents were recorded at different test voltages from a holding potential of −80 mV. Control cells (black dots) showed a larger current at all voltages tested than Sin3B-expressing cells (gray dots). (C) Conductance-voltage curves were calculated for each cell, and normalized to the average Gmax of control cells (black dots). A strong reduction of Gmax was observed in Sin3B-expressing cells (gray dots). Analysis of data showed no changes in VG1/2 or kG. (D) Inactivation curves. INa was recorded at −10 mV after inactivating pre-pulses of 200 ms. Peak currents were normalized to the average of INa recorded in control cells (black dots) and plotted as function of the pre-pulse voltage. The data from each cell were fitted with Boltzmann equations to calculate Vh1/2 and kh. On average, a small (5 mV) but statistically significant shift to the right was observed in Sin3B-expressing cells (gray dots). (E) Immunoreactivity for Nav channels from whole cell lysates, from three independent experiments, was measured by densitometry and normalized to the immunoreactivity of actin in control (black) and Sin3B-expressing cells (white). Inset: representative inmmunoblots with Pan Nav (upper panel) and anti-actin (lower panel) antibodies in control N1E-115 cells (lane 1) and cells expressing Sin3B 293 (lane 2). (F) In contrast, potassium currents were unaffected by overexpression of Sin3B at any voltage tested.

