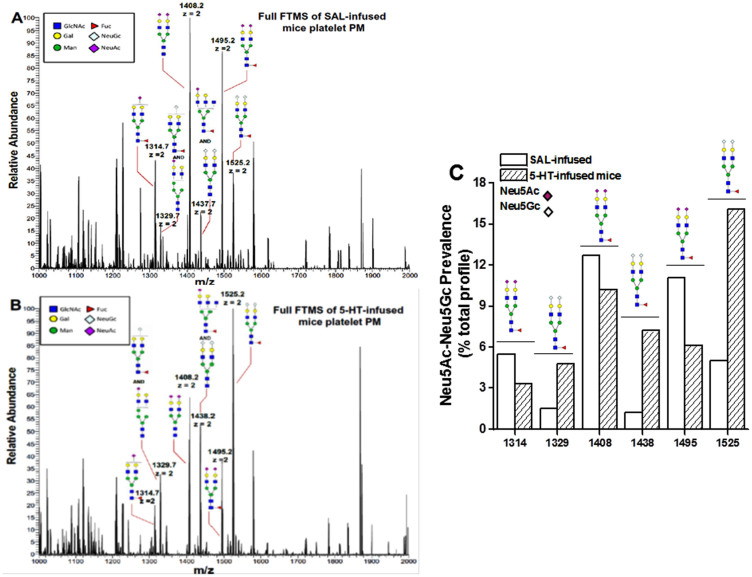
Figure 3. NSI-MS spectra of Neu5Ac and Neu5Gc containing structures in pair.
The membrane vesicles prepared from platelets of SAL- (A) or 5-HT-infused (B) WT mice show the Neu5Ac and Neu5Gc containing structures in pairs; such that 1314 ends with Neu5Ac which has a higher peak in platelets of SAL mice compared to 5-HT-infused mice. The pair for 1314 is 1329 as shown in MS/MS fragmentation, which has a lower peak in platelets from SAL- vs 5-HT-infused mice. Similarly, the pair for 1408 appears as 1438 and the pair for 1495 is 1525. (C) The ratio of Neu5Ac/Neu5Gc prevalence (% total profile) for each reaction was plotted. The bar graph presents the changes in Neu5Ac vs. Neu5Gc pairs in PM vesicles of platelets isolated from SAL and 5-HT-infused mice.

