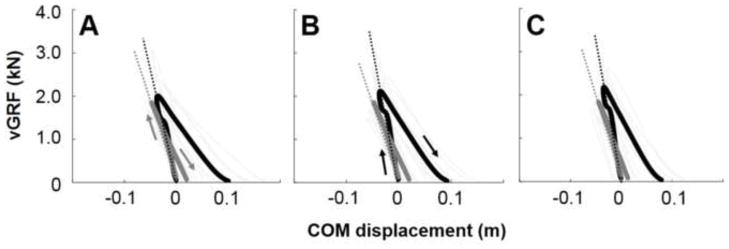
Figure 3.

Time-normalized vGRF-COM displacement curves during the ground contact in running at 2.5 (A), 3.0 (B) and 3.5 m/s (C), respectively. Black thick (INT) and gray thick (PST) curves are means of 8 subjects. Gray thin curves represent mean curves for each individual in each leg. The slopes (dotted lines) of these curves represent vertical stiffness. Kvert is the slope of the vGRF-COM displacement curve in the leg compression phase
