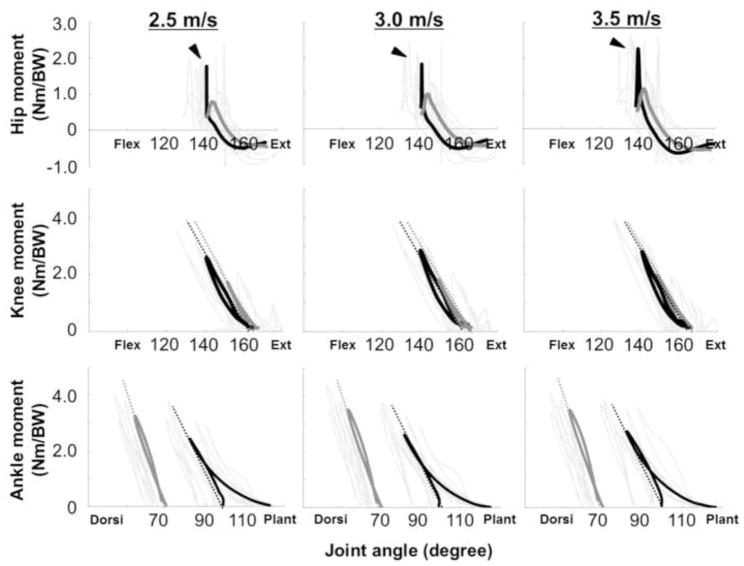
Figure 4.
Time-normalized moment-angle curves of the ankle, knee and hip joints during the ground contact in running at 2.5, 3.0 and 3.5 m/s, respectively. Arrows express the direction of the curve. In the figure, joint extension moments in each joint are represented as positive values. Black thick (INT) and gray thick (PST) curves are means of 8 subjects. Gray thin curves represent an individual value for each leg. The slopes (dotted lines) of these curves represent joint stiffnesses. Arrowheads indicate a peak hip extension moment at early stance phase in INT.

