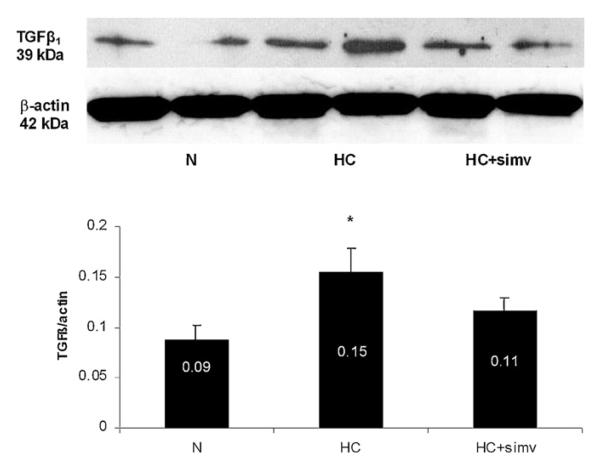
Fig. 3.
Representative immunoblot for TGFβ1 expression in the myocardium of animals on a normal diet (N), a high-cholesterol diet (HC), and a high-cholesterol diet with simvastatin (HC + simv) for 12 weeks. Bar graph illustrates the expression as a densitometric ratio to β-actin averaged for 6 samples per group; values are expressed as mean ± SEM, *p < 0.05 compared to animals on a normal diet.

