
Figure 4.
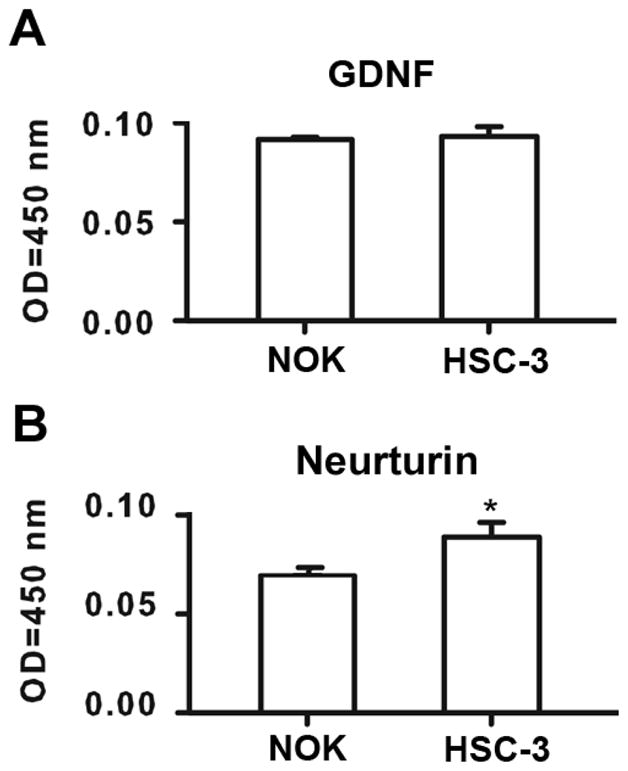
Neurotrophin concentration in OSCC cells. A. OSCC supernatant had similar GDNF concentration compared with that of NOKs. OD=optical density. B. OSCC supernatant had higher neurturin concentration compared with that of NOKs. Values are expressed in OD values measured at 450 nm wavelength.