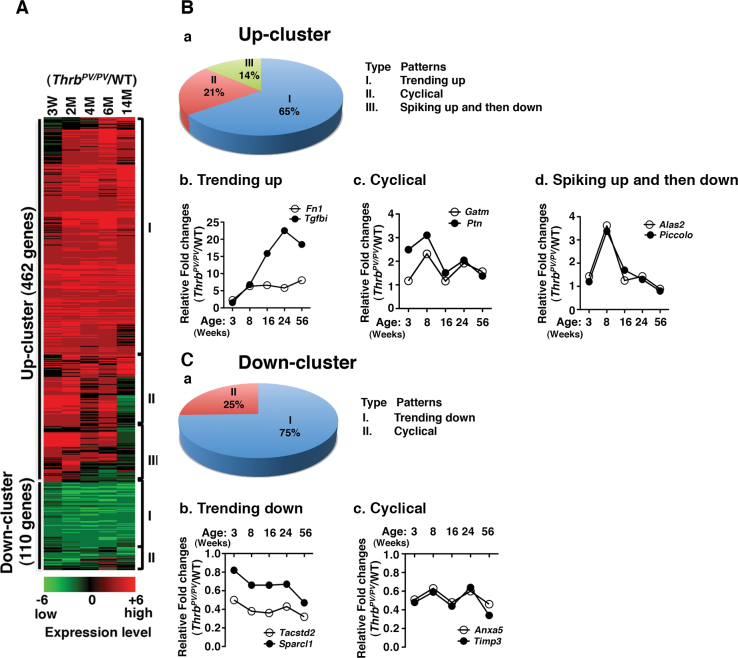
Fig. 1.
Identification of complex temporal changes in global gene expression patterns by microarray analysis. (A) Total RNA was extracted from thyroids of age- and gender-matched WT and Thrb PV/PV mice at 3, 8, 16, 24 and 56 weeks of age, and gene expression ratios of Thrb PV/PV to WT were calculated and grouped as either Up-cluster or Down-cluster genes. Each upregulated or downregulated gene is marked in either red or green, respectively and shown as a heat map in log2 scale. (B-a and C-a) Both the Up-cluster and the Down-cluster genes were further classified according to their gene expression patterns. The Up-cluster genes have three subgroups; the Down-cluster genes have two. (B-b, c and d) Two representatives from subgroups of the Up-cluster and two examples from the Down-cluster (C-b and c) genes were selected, and their expression patterns are shown. Data are expressed as ratios of fold changes in the expression of genes in Thrb PV/PV to those of WT mice.

