. 2013 Sep 28;2:e00961. doi: 10.7554/eLife.00961

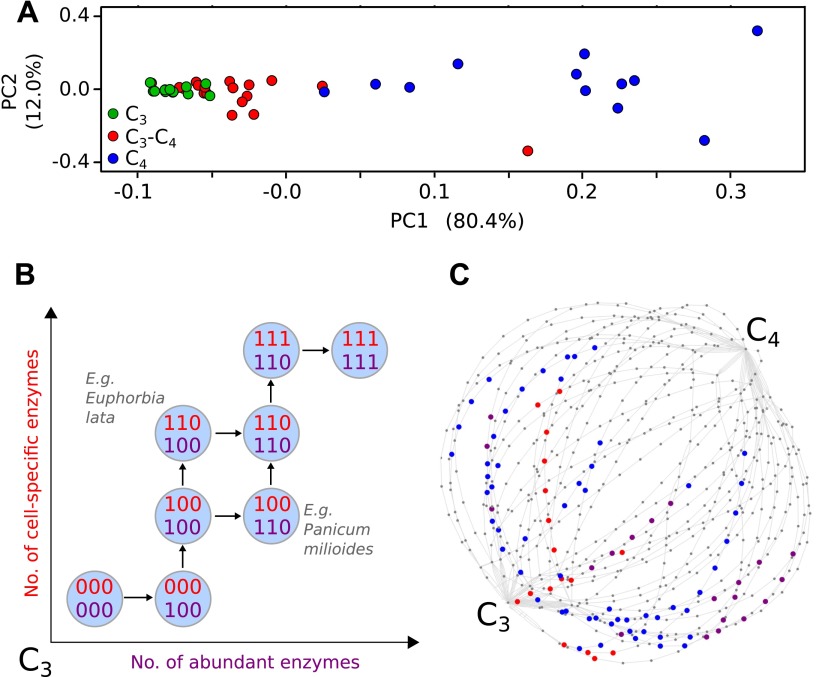
Figure 1. Evolutionary paths to C4 phenotype space modelled from a meta-analysis of C3–C4 phenotypes.

Principal component analysis (PCA) on data for the activity of five C4 cycle enzymes confirms the intermediacy of C3–C4 species between C3 and C4 phenotype spaces (A). Each C4 trait was considered absent in C3 species and present in C4 species, with previously studied C3–C4 intermediate species representing samples from across the phenotype space (B). With a dataset of 16 phenotypic traits, a 16-dimensional space was defined. (C) A 2D representation of 50 pathways across this space. The phenotypes of multiple C3–C4 species were used to identify pathways compatible with individual species (e.g., Alternanthera ficoides [red nodes] and Parthenium hysterophorus [blue nodes]), and pathways compatible with the phenotypes of multiple species (purple nodes).

DOI: http://dx.doi.org/10.7554/eLife.00961.004

Figure 1—source data 1. Binary scoring of C4 traits present in C3–C4 species.
The EM algorithm was used to assign binary scores for the presence or absence of 16 C4 traits in 37 C3–C4 intermediate species. 1 denotes the presence of a trait, 0 denotes absence. Blank cells denote traits that have not been defined.
elife00961s001.xlsx (798KB, xlsx)
DOI: 10.7554/eLife.00961.005

Figure 1.

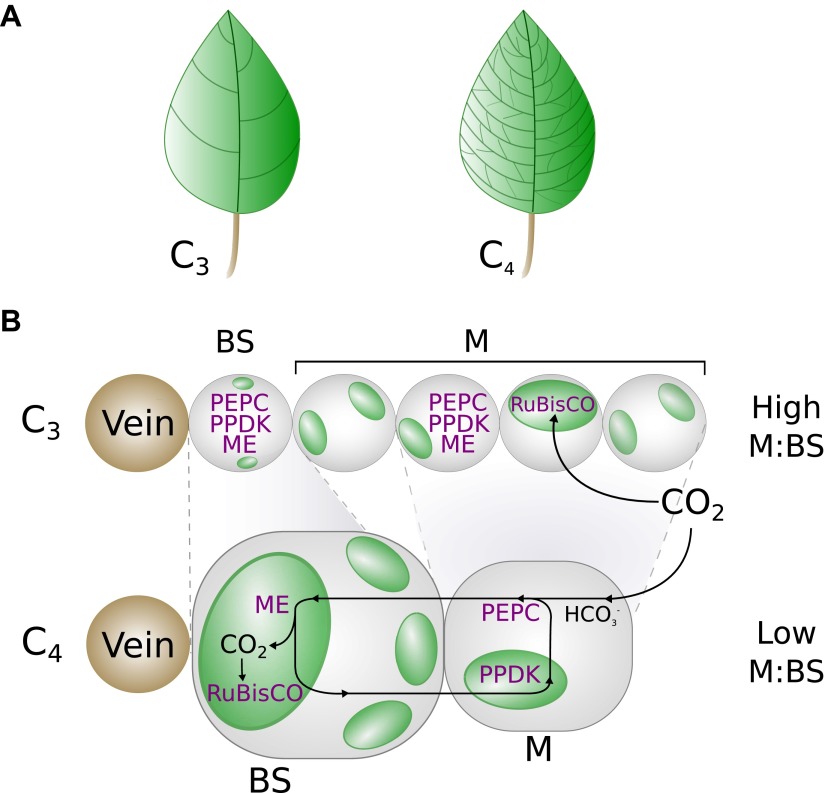
Figure 1—figure supplement 1. A graphical representation of key phenotypic changes distinguishing C3 and C4 leaves.

Figure 1—figure supplement 1.

Plants using C4 photosynthesis possess a number of anatomical, cellular, and biochemical adaptations that distinguish them from C3 ancestors. These include decreased vein spacing (A) and enlarged bundle sheath (BS) cells, which lie adjacent to veins (B). Together, these adaptations decrease the ratio of mesophyll (M) to BS cell volume. C4 metabolism is generated by the increased abundance and M or BS-specific expression of multiple enzymes (shown in purple), which are expressed in both M and BS cells of C3 leaves. Abbreviations: ME–Malic enzymes, RuBisCO—Ribulose1-5,Bisphosphate Carboxylase Oxygenase, PEPC–phosphoenolpyruvate carboxylase, PPDK–pyruvate,orthophosphate dikinase.
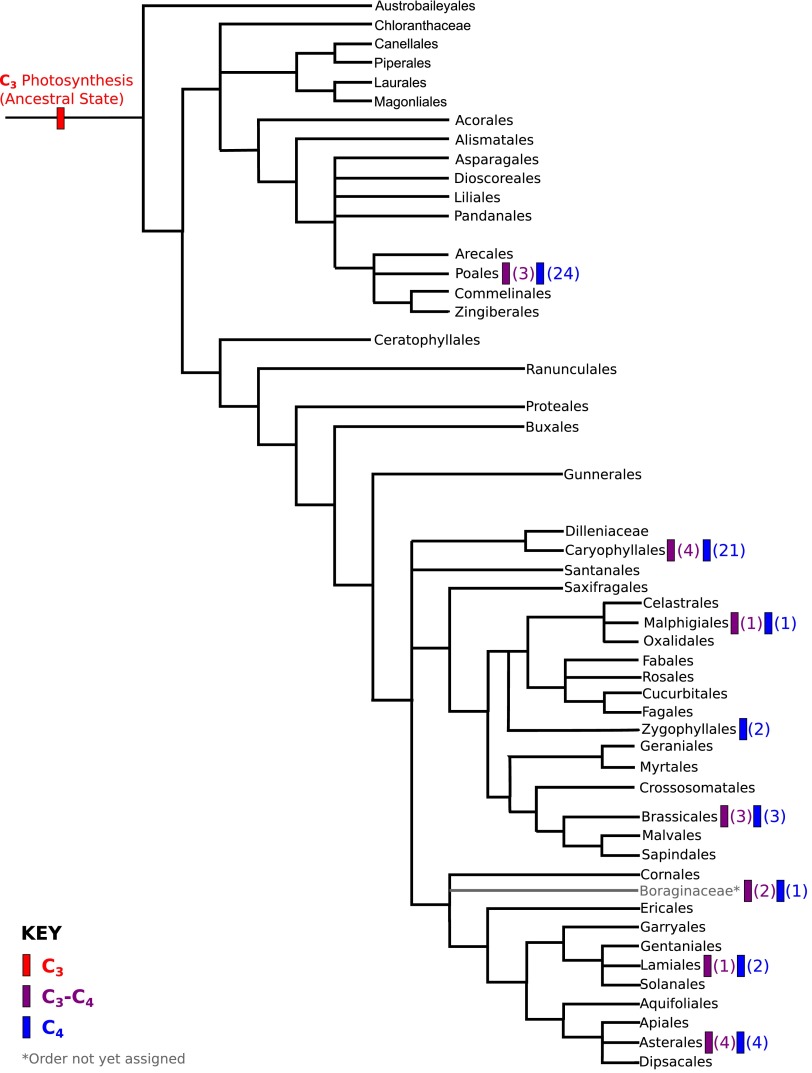
Figure 1—figure supplement 2. Phylogenetic distribution of C4 and C3–C4 lineages across the angiosperm phylogeny.

Figure 1—figure supplement 2.

A phylogeny of angiosperm orders is shown, based on the classification by the Angiosperm Phylogeny Group. The phylogenetic distribution of known two-celled C4 photosynthetic lineages are annotated, together with the distribution of C3-C4 lineages that we used in this study. The numbers of independent C3-C4, or C4 lineages present in each order are shown in parentheses.
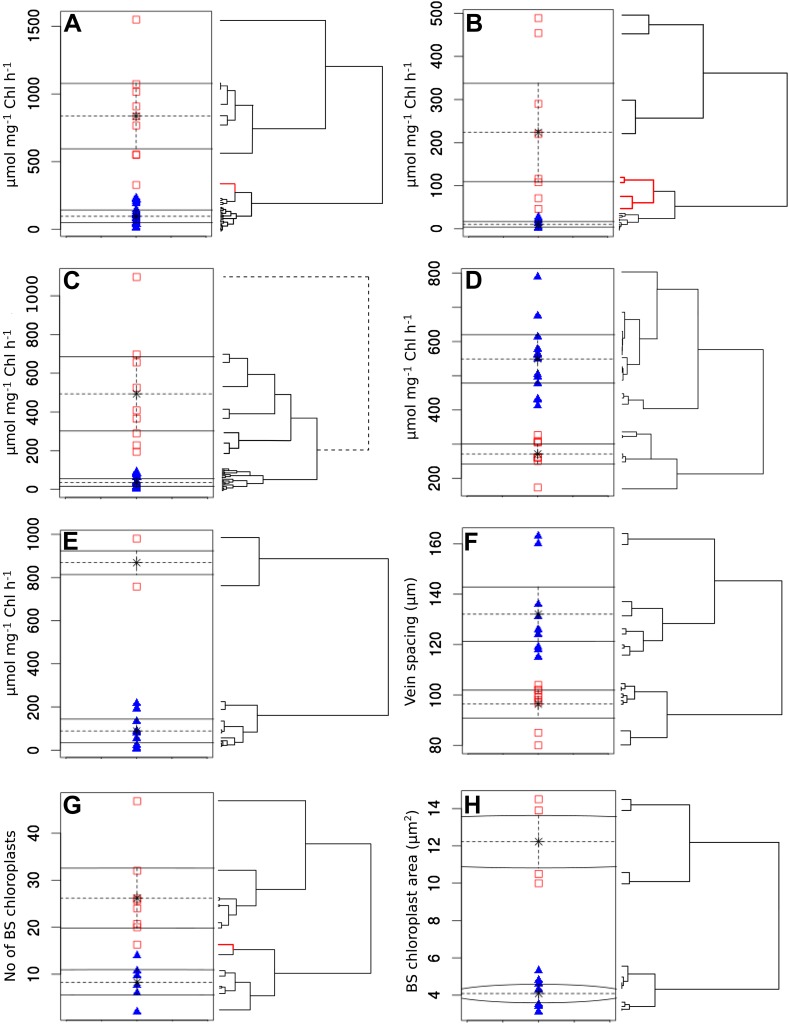
Figure 1—figure supplement 3. Clustering quantitative traits by EM algorithm and hierarchical clustering.

Figure 1—figure supplement 3.

Quantitative variables were assigned binary scores using two-data clustering techniques. Each panel depicts the assignation of presence (red squares) and absence (blue triangles) scores by the EM algorithm. Adjacent to the right are cladograms depicting the partitioning of the same values into clusters by hierarchical clustering. Red cladogram branches denote values partitioned into a different group to that assigned by EM. The variables depicted in each panel are PEPC activity (A), PPDK activity (B), C4 acid decarboxylase activity (C), RuBisCO activity (D), MDH activity (E), vein spacing (F), number of BS chloroplasts (G), BS chloroplast size (H).
Figure 1—figure supplement 4. Illustration of the principle by which evolutionary pathways emit intermediate signals.

Figure 1—figure supplement 4.

In this illustration, the phenotype consists of three traits, yielding a simple (hyper)cubic transition network. Simulated trajectories on this network evolve according to the weights of network edges (A). Probabilities were calculated from the signals emitted by simulated trajectories at intermediate nodes (B). Ensembles of trajectories were simulated to obtain probabilities from these signals for every possible evolutionary transition (C).